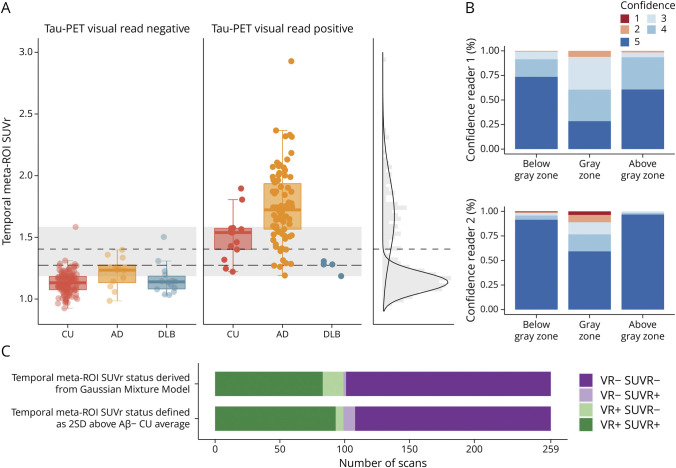
Figure 2. Comparing Tau-PET Visual Read With Tau-PET SUVr.
(A) Tau-PET SUVr in the temporal meta-ROI is plotted, stratified by diagnostic group (CU, AD, and DLB) and tau-PET visual read status (negative and positive). The short dashed line represents the SUVr cutoff derived from a GMM with the 2 Gaussian distributions plotted on the right. The long dashed line represents the SUVr cutoff defined as 2 SDs above the mean of Aβ negative CU participants. The gray zone represents visual read positive and visual read negative scans with overlapping SUVr. (B) The confidence of the 2 readers (ranging from 1 to 5) is shown for scans below the gray zone, within the gray zone, and above the gray zone. (C) The number of scans with concordant or discordant VR and SUVr status (based both GMM and mean + [2 × SD]) is shown. Aβ = β-amyloid; AD = Alzheimer disease; CU = cognitively unimpaired; DLB = dementia with Lewy bodies; GMM = Gaussian mixture model; ROI = region of interest; SUVr = standardized uptake value ratio; VR = visual read.

