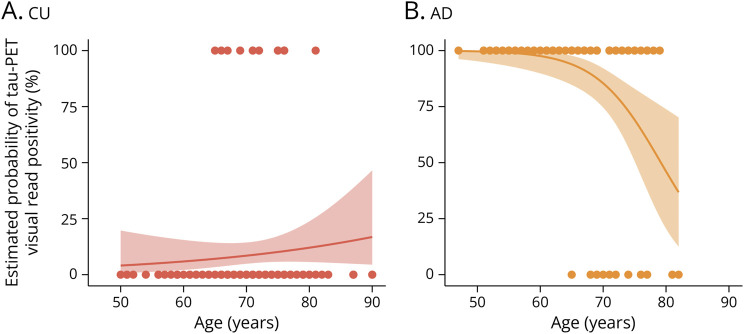
Figure 4. Estimated Probabilities of Tau-PET Visual Read Positivity According to Age.
Plotted are the predicted probabilities of tau-PET visual read positivity according to age obtained from a logistic regression between tau-PET visual read (outcome) and age (predictor). We additionally superimposed individual data points to better visualize the distribution of tau-negative and tau-positive cases according to age. A trend toward a positive association between age and probability of tau-PET positivity was observed in CU participants (A), whereas a strong negative association between age and probability of tau-PET positivity was observed in participants with AD (B). AD = Alzheimer disease; CU = cognitively unimpaired.

