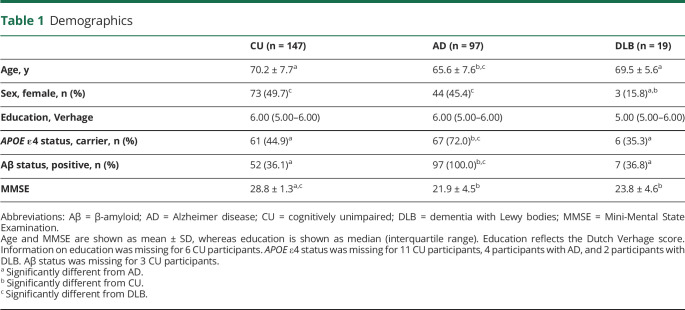
Table 1.
Demographics
| CU (n = 147) | AD (n = 97) | DLB (n = 19) | |
| Age, y | 70.2 ± 7.7a | 65.6 ± 7.6b,c | 69.5 ± 5.6a |
| Sex, female, n (%) | 73 (49.7)c | 44 (45.4)c | 3 (15.8)a,b |
| Education, Verhage | 6.00 (5.00–6.00) | 6.00 (5.00–6.00) | 5.00 (5.00–6.00) |
| APOE ε4 status, carrier, n (%) | 61 (44.9)a | 67 (72.0)b,c | 6 (35.3)a |
| Aβ status, positive, n (%) | 52 (36.1)a | 97 (100.0)b,c | 7 (36.8)a |
| MMSE | 28.8 ± 1.3a,c | 21.9 ± 4.5b | 23.8 ± 4.6b |
Abbreviations: Aβ = β-amyloid; AD = Alzheimer disease; CU = cognitively unimpaired; DLB = dementia with Lewy bodies; MMSE = Mini-Mental State Examination.
Age and MMSE are shown as mean ± SD, whereas education is shown as median (interquartile range). Education reflects the Dutch Verhage score. Information on education was missing for 6 CU participants. APOE ε4 status was missing for 11 CU participants, 4 participants with AD, and 2 participants with DLB. Aβ status was missing for 3 CU participants.
Significantly different from AD.
Significantly different from CU.
Significantly different from DLB.

