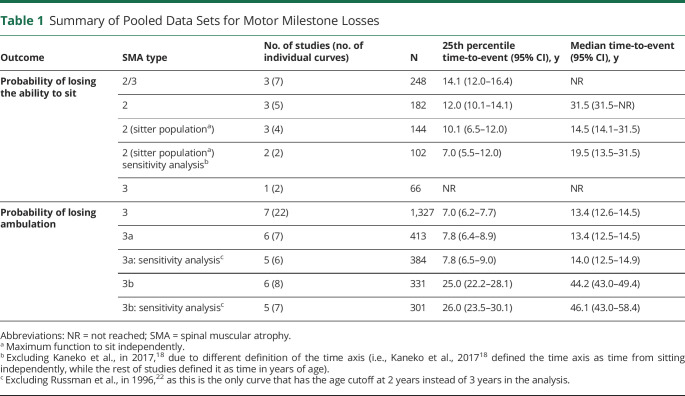
Table 1.
Summary of Pooled Data Sets for Motor Milestone Losses
| Outcome | SMA type | No. of studies (no. of individual curves) | N | 25th percentile time-to-event (95% CI), y | Median time-to-event (95% CI), y |
| Probability of losing the ability to sit | 2/3 | 3 (7) | 248 | 14.1 (12.0–16.4) | NR |
| 2 | 3 (5) | 182 | 12.0 (10.1–14.1) | 31.5 (31.5–NR) | |
| 2 (sitter populationa) | 3 (4) | 144 | 10.1 (6.5–12.0) | 14.5 (14.1–31.5) | |
| 2 (sitter populationa) sensitivity analysisb | 2 (2) | 102 | 7.0 (5.5–12.0) | 19.5 (13.5–31.5) | |
| 3 | 1 (2) | 66 | NR | NR | |
| Probability of losing ambulation | 3 | 7 (22) | 1,327 | 7.0 (6.2–7.7) | 13.4 (12.6–14.5) |
| 3a | 6 (7) | 413 | 7.8 (6.4–8.9) | 13.4 (12.5–14.5) | |
| 3a: sensitivity analysisc | 5 (6) | 384 | 7.8 (6.5–9.0) | 14.0 (12.5–14.9) | |
| 3b | 6 (8) | 331 | 25.0 (22.2–28.1) | 44.2 (43.0–49.4) | |
| 3b: sensitivity analysisc | 5 (7) | 301 | 26.0 (23.5–30.1) | 46.1 (43.0–58.4) |
Abbreviations: NR = not reached; SMA = spinal muscular atrophy.
Maximum function to sit independently.
Excluding Kaneko et al., in 2017,18 due to different definition of the time axis (i.e., Kaneko et al., 201718 defined the time axis as time from sitting independently, while the rest of studies defined it as time in years of age).
Excluding Russman et al., in 1996,22 as this is the only curve that has the age cutoff at 2 years instead of 3 years in the analysis.

