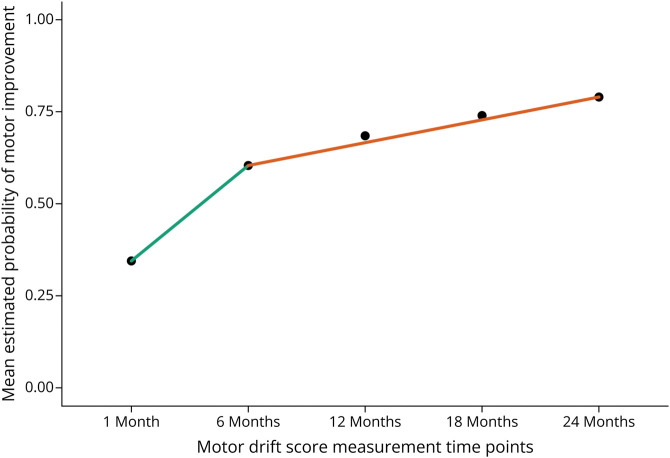
Figure 1. Nonlinear Probability of Motor Improvement Over Time.
The nonlinear relationship of the mean probability of motor improvement for each follow-up time point since study randomization. The green and orange line segments highlight the notable change in slope from 1- to 6-month visits to 6- to 24-month visits after randomization. The nonlinear relationship of motor improvement time is well known from chronic stroke rehab trials of the upper extremity.

