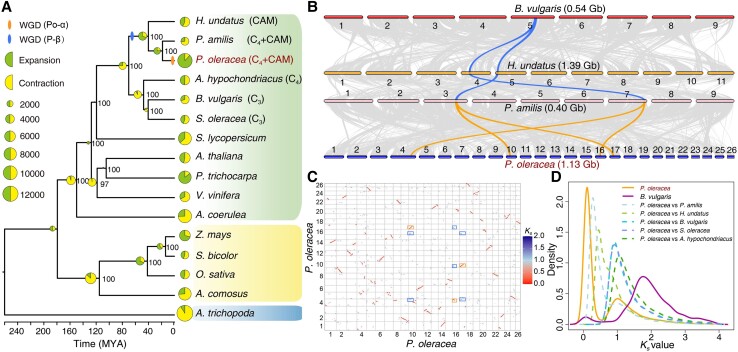
Figure 2.
Evolutionary analysis of the common purslane genome. A) Phylogenetic species tree constructed based on single-copy putative orthologs. The lineage divergence times (Mya) and gene family expansion and contraction are shown. The divergence times were estimated by r8s (v1.81). The pie charts at each branch of the tree represent the proportion of gene families undergoing gain or loss events. The size of the pie charts is proportional to the number of gene families expanded (green) or contracted (yellow). The numbers at each branch represent the percentage support. B) Macrosynteny comparisons among B. vulgaris (0.54 Gb), H. undatus (1.39 Gb), P. amilis (0.40 Gb), and P. oleracea (1.13 Gb) revealing a 1:2:2:4 ratio, the region highlighted in orange provides 1 example. C) Syntenic dot plot of P. oleracea against itself. Syntenic gene pairs were colored as a function of the synonymous substitution rate (Ks) values (Ks > 1, blue; Ks < 1, red). The recent and relatively ancient WGDs are highlighted by the orange and blue boxes, respectively. D)Ks distribution in the identified syntenic putatively paralogous blocks from P. oleracea and B. vulgaris (solid lines), and P. oleracea putative orthologs with 5 other species (dashed lines).

