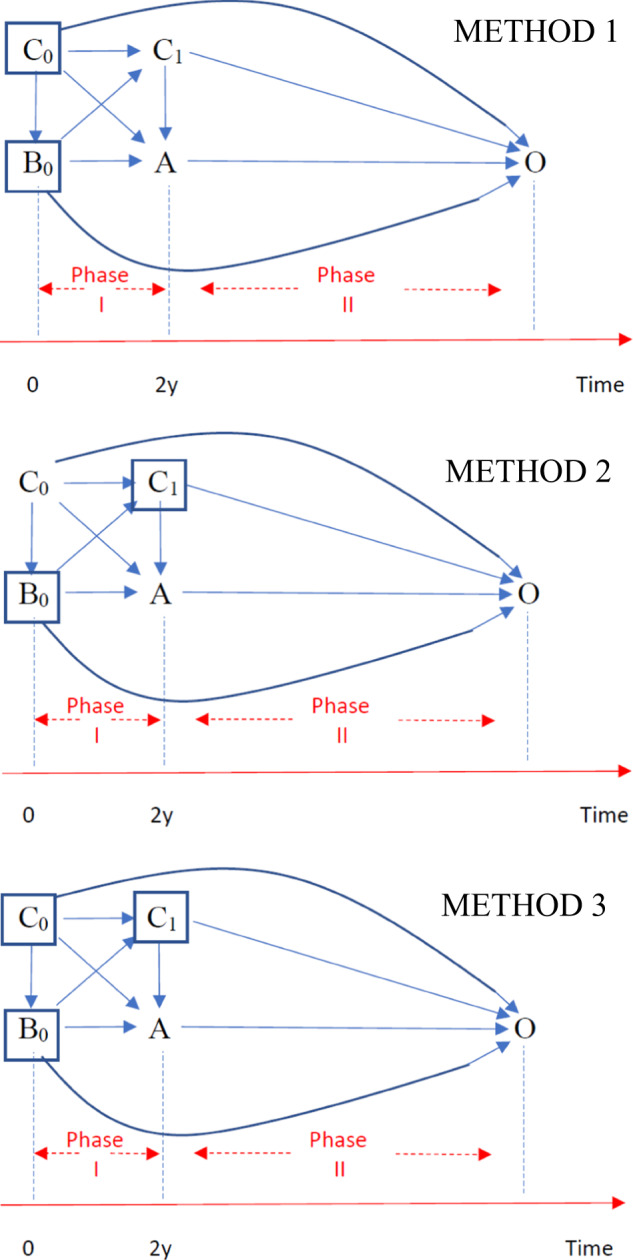
Fig. 1. Directed acyclic graphs for the effect of weight change on CVD, using 3 different methods.

METHOD 1 (Upper Panel): B0 is weight at time 0 and B1 is weight at 2 years. C0 are the confounders at time 0 and C1 are the confounders at 2 years and O is the outcome. Time is split into two phases. Phase I is between weight measurements at time 0 and the 1st follow-up. Phase II is after the weight measurement at the 1st follow-up weight change is only observed at 2 years (end of Phase I), i.e. when we can measure A = B1-B0. A and B1 can be used in the DAG interchangeably, as they are deterministically related. Our aim is to find the effect of A (weight change) on the outcome O. From this DAG, we stratify for B0 and we control for C0. However, we do not control for C1 (or exclude individuals based on levels of chronic disease at the 1st follow-up). Our aim is to find the effect of A (weight change) on the outcome O. If we do not control for C1, we leave the backdoor path A<--C1-->O open. METHOD 2 (Middle Panel): B0 is weight at time 0 and B1 is weight at 2 years. C0 are the confounders at time 0 and C1 are the confounders at 2 years and O is the outcome. Time is split into two phases. Phase I is between weight measurements at time 0 and the 1st follow-up. Phase II is after the weight measurement at the 1st follow-up. weight change is only observed at 2 years (end of Phase I), i.e. when we can measure A = B1–B0. Our aim is to find the effect of A (weight change) on the outcome O. From this DAG, we stratify for B0 and we control for C1. However, we do not control for C0 (or exclude individuals based on levels of chronic disease at the time 0). If we do not control for C0, we leave the backdoor path A<--C0-->O open. METHOD 3 (Lower Panel): B0 is weight at time 0 and B1 is weight at the 1st follow-up (at 2 years). C0 are the confounders at time 0 and C1 are the confounders at 2 years and O is the outcome. Time is split into two phases. Phase I is between weight measurements at time 0 and the 1st follow-up. Phase II is after the weight measurement at the 1st follow-up. Weight change is only observed at the 1st follow-up (end of Phase I), i.e. when we can measure A = B1–B0. A and B1 can be used in the DAG interchangeably, as they are deterministically related. Our aim is to find the effect of A (weight change) on the outcome O. From this DAG, we stratify for B0 and we control for C0 and C1. In other words, there is no backdoor path open.
