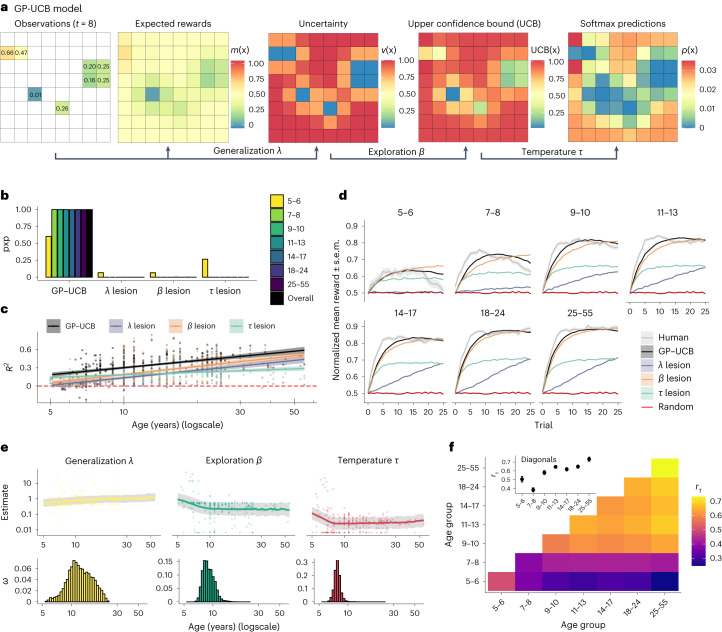
Fig. 3. Model results.
a, Illustration of the GP-UCB model based on observations at the eighth trial (showing normalized reward). We use GP regression as a psychological model of reward generalization38, making Bayesian estimates about the expected rewards and uncertainty for each option. The free parameter λ (equation (2)) controls the extent that past observations generalize to new options. The expected rewards m(x) and uncertainty estimates v(x) are combined using UCB sampling (equation (3)) to produce a valuation for each option. The exploration bonus β governs the value of exploring uncertain options relative to exploiting high reward expectations. Lastly, UCB values are entered into a softmax function (equation (4)) to make probabilistic predictions about where the participant will search next. The decision temperature parameter τ governs the amount of random (undirected) exploration. b, Hierarchical Bayesian model selection, where pxp defines the probability of each model being predominant in the population (see Supplementary Fig. 2 and Supplementary Table 3 for more details). c, Predictive accuracy (R2) as a function of age. Each dot is a participant and the lines and ribbons show the slope (±95% CI) of a linear regression. d, Simulated learning curves, using participant parameter estimates. Human data illustrates the mean (±95% CI), while model simulations report the mean. e, Top, participant parameter estimates as a function of age. Each dot is a single participant, with the line and ribbon showing the posterior predictions (±95% CI) from a Bayesian changepoint regression model. Bottom, posterior distribution of which age the changepoint (ω) is estimated to occur. f, Similarity matrix of parameter estimates. Using Kendall’s rank correlation (rτ), we report the similarity of parameter estimates both within and between age groups. The within age group similarities (diagonals) are also visualized in the inset plot, where dots show the mean and error bars indicate the 95% CI. Refer to Fig. 2a for sample sizes of age groups.

