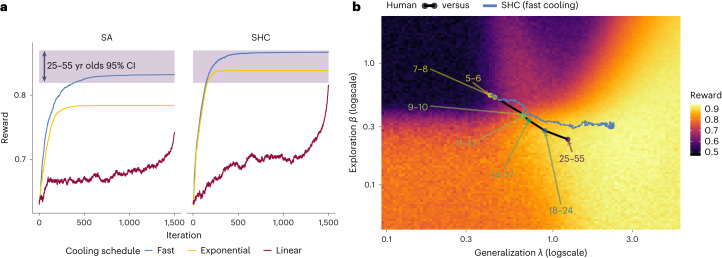
Fig. 4. Developmental trajectory.
a, Mean reward in each iteration for SA and SHC algorithms, combined with fast, exponential and linear cooling schedules. The shaded purple band indicates the 95% CI of human performance in the 25–55 age group. b, Comparison of human and algorithm trajectories, focusing on the best-performing SHC fast cooling algorithm. The annotated dots show the median parameter estimates of each age group, while the blue line shows the trajectory of the optimization algorithm (median overall all simulations). This two-dimensional illustration focuses on changes in generalization λ and directed exploration β (see Supplementary Fig. 6 for all algorithms and all parameter comparisons), with the underlying fitness landscape depicted using the median τ estimate across all human data ().

