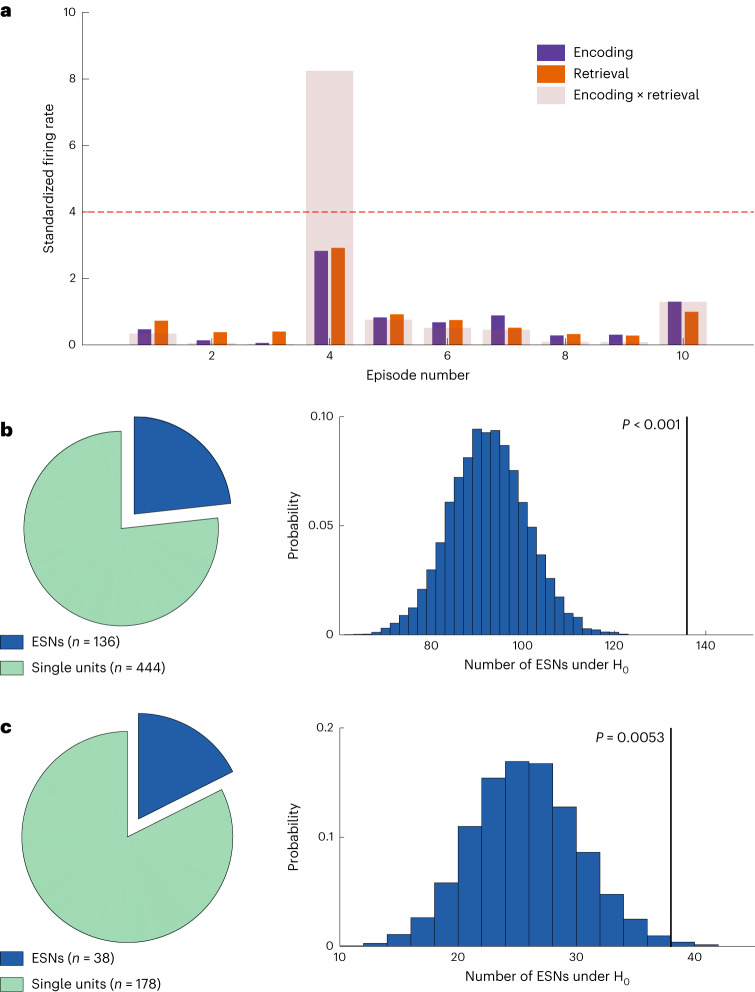
Fig. 2. Analysis schematic and number of ESNs identified in Experiments 1 and 2.
a, A schematic for identifying ESNs. The plot shows the z-scored firing rate on the y axis for ten simulated episodes on the x axis colour-coded for encoding and retrieval (purple and orange, respectively). The transparent bars encompassing encoding and retrieval indicate the product of encoding and retrieval firing rates, which is used as the measure of episode-specific firing reinstatement. The dashed red line shows the threshold (derived from a shuffling procedure; Methods). Because of the way ESNs are defined, they are required to fire substantially above their average firing rate during encoding and retrieval, which rules out neurons that generally show an increased firing rate during remembered episodes. b, Identified ESNs during Experiment 1. Left, the number of ESNs that showed significant firing reinstatement to at least one episode (dark blue) and the number of neurons that showed no firing reinstatement (green). Right, the number of ESNs expected by chance and the empirical number of ESNs (136 out of 585 neurons; P < 0.001; one-sided permutation test). c, Same as b but for Experiment 2. Of a total of 216 hippocampal neurons, we identified 38 ESNs (P = 0.0053; one-sided permutation test).

