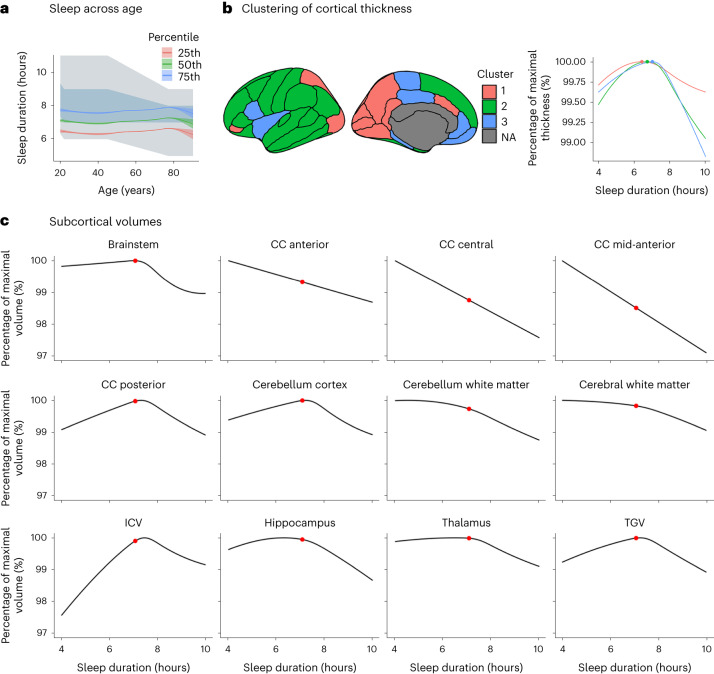
Fig. 1. Cross-sectional relationships.
a, Self-reported sleep duration superimposed on the recommended sleep intervals from the National Sleep Foundation. The blue/grey area depicts the recommended sleep interval (blue indicates ‘recommended’; grey indicates ‘may be appropriate’). The green line shows average self-reported sleep in this study; the blue and red lines show the 75th and 25th percentiles, respectively. The shaded area around each curve shows the 95% CI. b, Clusters of regions showing similar relationships between thickness and sleep duration. The graph shows thickness in each cluster as a function of sleep duration. The maximum thickness is 100%, illustrated by the coloured dots. NA, non-cortical region. c, Subcortical and global volumes as a function of sleep duration. The maximum volume is 100%. The red dots show the average reported sleep duration. Only regions significantly related to sleep duration are shown. The plots are corrected for baseline age, sex, site, follow-up time and ICV (except for the ICV plot). CC, corpus callosum.

