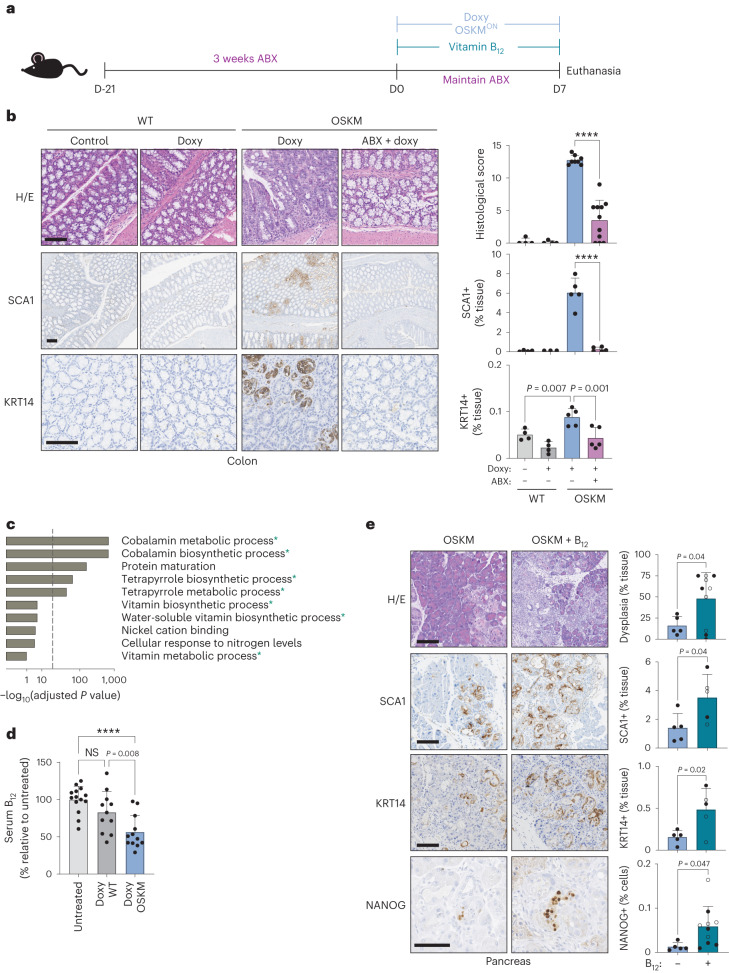
Fig. 1. In vivo OSKM reprogramming requires the gut microbiota and is enhanced by vitamin B12 supplementation.
a, Mice were pretreated with an antibiotic cocktail administered in the drinking water for 3 weeks (ABX) before, and during, 7 d of doxycycline administration (doxy), with or without vitamin B12 supplementation according to the schematic. b, Representative histology images and quantification of a blinded histological score, SCA1 staining and KRT14 staining. n = 4 mice (WT; 3 M 1 F), n = 8 (OSKM + doxy; 4 M 4 F), n = 11 (OSKM + doxy + ABX 4 M 7 F); a representative subset of animals was analysed for SCA1 and KRT14. Scale bar, 100 µm. c, GO pathway analysis of differentially abundant microbial gene signatures in the metagenome sequencing of stool samples. Changes in microbial gene abundance between day 7 and day 0 were compared in a subset of WT (n = 4; 2 M 2 F) and OSKM (n = 4; 2 M 2 F) mice from b. See Supplementary Table 1 for complete gene list. The overlap between GO terms and the 200 most differentially depleted or enriched genes was scored using standard hypergeometric tests and GO terms above a threshold of 30% FDR are shown (for all GO terms, see Supplementary Table 2). Processes marked with an asterisk are directly related to cobalamin metabolism. Dashed line indicates 5% FDR cut-off. d, Serum holoTC (biologically available vitamin B12) levels as measured by ADVIA immunoassay in untreated mice or WT and OSKM mice treated with doxycycline for 7 d. n = 14 mice (untreated; 6 M 8 F), n = 11 (doxy WT doxy; 7 M 4 F), n = 12 (doxy OSKM doxy; 6 M 6 F). e, OSKM mice received vitamin B12 supplementation co-administered with doxycycline as indicated and representative images and quantification are shown for the indicated markers in the pancreas. Mice marked by an open circle received both B12 and folate (B9) supplementation (not significant (NS) difference for B12 versus B12 + folate; see text for details). n = 5 mice (OSKM; 2 M 3 F), n = 10 mice (OSKM + B12; 4 M 6 F); a representative subset of n = 5 animals per group was analysed for SCA1 and KRT14. Scale bars, 100 µm. Bar graphs represent the average ± s.d.; ****P < 0.0001 by two-tailed Student’s t-test.

