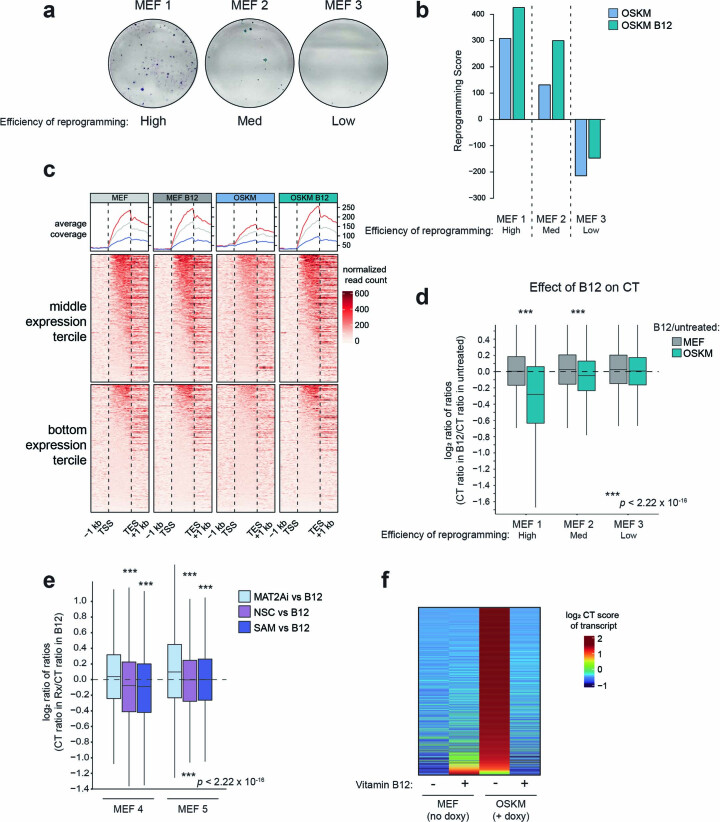
Extended Data Fig. 7. Reprogramming and transcriptional dynamics across MEF clones.
(a) The reprogramming efficiency of three independent MEFs was measured by the formation of iPS colonies as stained with alkaline phosphatase 10 days after continuous addition of doxycycline to the media. (b) The Reprogramming Score was calculated using transcriptional data from MEFs expressing doxycycline-inducible OSKM for 72 h, whose cell surface markers indicated they were poised for high-efficiency reprogramming48. See Methods for details. (c) H3K36me3 chromatin immunoprecipitation (ChIP) sequencing was performed in Clone 1, 72 h after the addition of doxycycline and/or vitamin B12, as indicated. The normalized ChIP reads in gene bodies relative to all aligned reads are shown for the middle and bottom tercile in terms of gene expression (as determined by RNA-seq RPKM levels across all condition) are shown (lower). The trace of the ChIP signal is shown, where the y-axis represents average coverage across genes (upper; blue = bottom tercile; grey = middle tercile; red = top tercile, shown for reference; see Fig. 4a for top tercile). TSS – transcription start site; TES – transcription end site. (d-e) The ratio of cryptic transcription (CT). (d) CT in B12-treated cells as compared to non-B12 is shown for the median CT ratio for all genes for which a score could be calculated is plotted. Individual MEFs (n = 3 total) are shown, separated into MEF (no doxycycline) and OSKM (72 h of doxycycline treatment to induce OSKM expression) conditions. Asterisks represent the comparison between the MEF and OSKM bars. (e) OSKM cells were treated with doxycycline and the indicated compounds for 72 h, as described in Fig. 4c. The ratio of CT is plotted as a ratio of the CT in the B12 condition for each treatment, in n = 2 independent MEFs. Asterisks represent the comparison between the indicated treatment and the MAT2Ai treatment. The lower and upper hinges correspond to the first and third quartiles (the 25th and 75th percentiles). The upper (lower) whisker extends from the hinge to the largest (smallest) value no further than 1.5 * IQR from the hinge. P-values were determined by two-tailed unpaired Wilcoxon test no multiple comparisons adjustment (f) Genes whose CT increases upon reprogramming (top 25% comparing OSKM vs. MEF) and decrease with vitamin B12 supplementation (top 25% comparing OSKM B12 vs. OSKM) in Clone 1, used for the hypergeometric analysis in Fig. 4d. The CT ratio of individual genes is shown for each condition.

