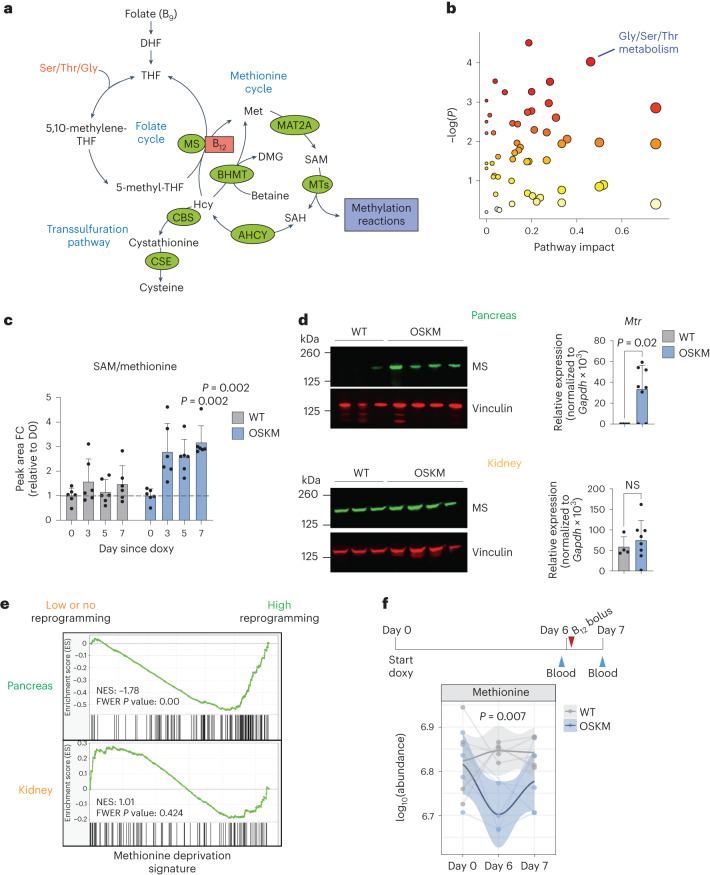
Fig. 2. Tissues undergoing in vivo reprogramming exhibit an increased demand of 1C metabolism.
a, Summary of the mammalian folate and methionine cycles (1C metabolism) and the transsulfuration pathway. Enzymes are marked in green. Coenzyme vitamin B12 is marked in red. DHF, dihydrofolate; THF, tetrahydrofolate; MTs, methyltransferases; ACHY, adenosylhomocysteinase; CSE, cystathionine gamma-lyase; DMG, dimethylglycine; Ser, serine; Thr, threonine; Gly, glycine. Figure adapted from ref. 33, Springer Nature Limited. b, Changes in metabolic pathways during reprogramming. MetaboAnalyst (4.0)91 was used to assess the annotated metabolites identified in the serum of paired OSKM mice (n = 6; 3 M 3 F) at day 5 versus day 0 of doxycycline treatment (serum was collected repeatedly from the same mice). Colour gradient from white to red indicates the P value; red is most significant. Gly/Ser/Thr metabolism (KEGG map00260) is highlighted. See Supplementary Table 3 for all metabolites, pathways and scores. c, Fold change (FC) of SAM/Met ratio detected by mass spectrometry from b on the indicated days. P values represent significant difference between OSKM and WT mice. d, Levels of MS (encoded by Mtr) by immunoblot and RT–qPCR in the pancreas (upper) and kidney (lower) from WT (n = 4; 3 M 1 F) and OSKM (n = 8; 4 M 4 F) mice treated with doxycycline for 7 d. Representative mice are shown in the immunoblot. e, Previously published RNA-seq data16 from the pancreas (highly prone to reprogramming; green) and kidney (refractory to reprogramming; orange) of OSKM-Cdk2na−/−(low or absent reprogramming) and OSKM-Tp53−/− (high reprogramming) mice were used to perform GSEA against a published signature (MsigDB: M13537) of Met deprivation39. f, WT and OSKM mice (n = 5 per group; 5 M) were treated with doxycycline and a bolus of vitamin B12 as shown in the schematic. Met levels were measured in the indicated serum samples by mass spectrometry. Only n = 4 WT (day 0) and OSKM (day 6) mice are represented, as the blood volume was insufficient. Welch’s two-sample t-test was used to evaluate differences between groups on day 6. Bar graphs represent the average ± s.d.; P values determined by a two-tailed Student’s t-test.

