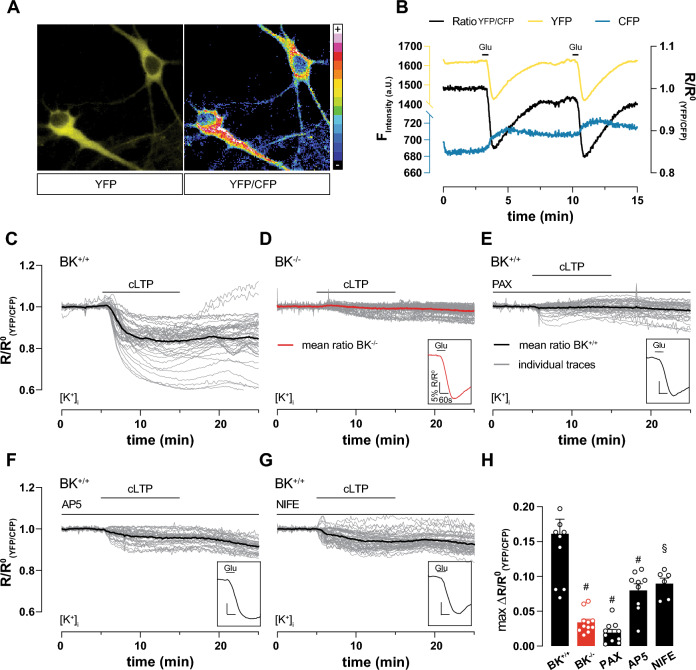
Fig. 4.
cLTP induction causes massive K+ outflow depending on BK, NMDAR and LTCC. Live imaging of 9 DIV hippocampal neuronal cultures (representative cells in A), virally transduced at 7 DIV with the FRET-based K+-sensitive sensor (GEPII), allowed single-cell live recording of [K+]i in response to external stimuli. (B) Representative time course of ratio between single fluorescence intensities (YFP/CFP, black) highlights reduction of [K+]i after repeated application of 20 µM glutamate. Single fluorescence intensities shown in yellow and blue as indicated. C–G Individual (gray) and averaged (black or red in (D)) YFP/CFP in response to cLTP induction in neurons. Glutamate (20 µM) application at the end of each measurement verified cell viability (inset on lower right of each panel). C cLTP strongly and persistently decreased [K+]i in BK+/+ (n = 11 independent experiments from a total of n = 54 neurons obtained from N = 6 preparations). D cLTP induction failed to decrease [K+]i in BK−/− (n = 9 independent experiments with a total of n = 48 neurons obtained from N = 5 preparations). E BK inhibition by PAX (5 µM) prevented decrease of [K+]i during cLTP (n = 10) independent experiments from a total of n = 43 neurons obtained from from N = 5 preparations). F Compared to vehicle, NMDAR inhibition by AP5 (100 µM) significantly reduced K+ efflux during cLTP (n = 9 independent experiments with a total of n = 37 neurons obtained from N = 5 preparations). G Compared to vehicle, LTCC inhibition by NIFE (5 µM) significantly reduced K+ efflux during cLTP (n = 6 independent experiments with a total of n = 52 neurons obtained from N = 4 preparations). H Maximum differences between average baseline and minimum YFP/CFP during cLTP recordings in panels C-G to corresponding BK+/+ condition: § = p ≤ 0.01; # = p ≤ 0.001. Statistics: One-way ANOVA with Dunnett's multiple comparison test. All bar diagrams presented as means ± SEM. See also Fig. S4 and Table S4

