Fig. 5.
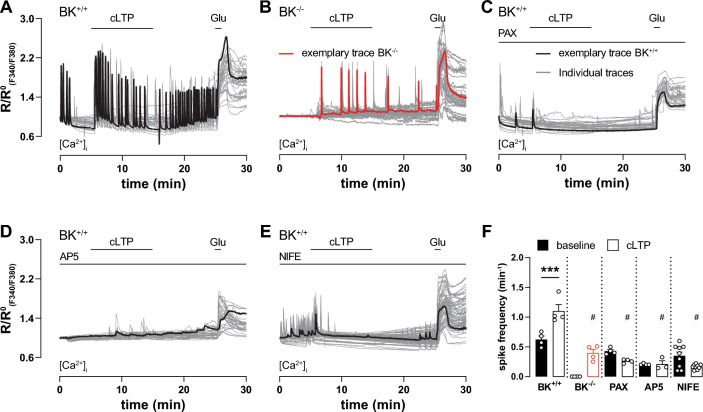
Ca2+ oscillations during cLTP induction depend on BK, NMDAR and LTCC. A–E Time course of ratio between fluorescence intensities at 340 nm and 380 nm (RF340/F380) in 9 DIV hippocampal neuronal cultures loaded with the Ca2+-sensitive dye Fura-2-AM. Traces recorded from individual neurons during multiple measurements are plotted in grey, representative traces in black except for (B) which is in red. Glutamate (20 µM) application at the end of each measurement verified cell viability and served as positive control. A, B Neuronal Ca2+ oscillations spontaneously occurred under control conditions in BK+/+ (A; n = 4 independent experiments with a total of n = 31 neurons obtained from 4 preparations) but not BK−/− neurons (B; n = 4 independent experiments with a total of n = 35 neurons obtained from 3 preparations). In BK+/+, cLTP induction increased oscillation frequency to a significantly higher degree than in BK−/−. C–E Inhibition of BK, NMDAR, and LTCC by 10 min pre-incubation with 5 µM PAX (C; n = 4 independent experiments with a total of n = 29 neurons obtained from 3 preparations), 100 µM AP5 (D; n = 4 independent experiments with a total of n = 29 neurons obtained from 3 preparations) and 5 µM NIFE (E; n = 4 independent experiments with a total of n = 69 neurons obtained from 5 preparations), respectively, reduced spontaneous Ca2+ oscillations and prevented the cLTP-induced rise in frequency. F Spiking frequency before and after cLTP induction in indicated conditions. cLTP increased Ca2+ oscillation frequency in BK+/+ neurons. Genetically or pharmacological BK inhibition as well as AP5 and NIFE prevented frequency increase. Compared with corresponding BK+/+ condition: # = p ≤ 0.001. Statistics: Two-way ANOVA with Tukey's multiple comparison test. All bar diagrams presented as means ± SEM. See also Table S5

