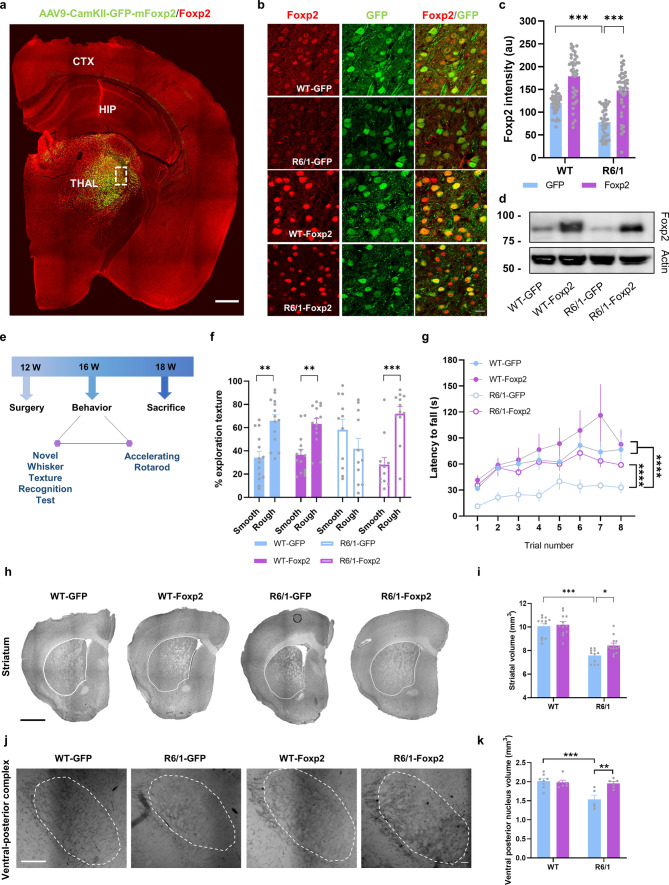
Fig. 3.
Restoration of thalamic Foxp2 levels and behavioral assessment of sensory-motor disturbances in the R6/1 mice. a Expression and distribution of Foxp2 (in red) in the transduced (in green) R6/1 mice. Scale bar, 500 µm. b Representative photomicrographs illustrating high magnifications of inset from a showing Foxp2 (red) nuclei expression and localization with GFP (green) in WT-GFP, R6/1-GFP (mice injected with a control AAV-CaMKII-GFP vector), WT-Foxp2 and R6/1-Foxp2 (mice injected with an AAV-CaMKII-Foxp2-GFP vector to over-express Foxp2) mice. Scale bar, 10 µm. c Quantification of the integrated optical density (IOD, arbitrary units) of the transduced Foxp2-positive nuclei in the thalamus as in b. Two-way ANOVA, group effect: F(1,155) = 32.75; p < 0.0001; treatment effect: F(1,38) = 100.3; p < 0.0001. (n = 40 nuclei per group, from 4 mice per group). d Results in c were verified by western blot. e Timeline represented in weeks (W) of behavioral testing in the transduced WT-GFP, R6/1-GFP, WT-Foxp2 and R6/1-Foxp2 mice. f % Time investigating texture object in the Novel Whisker Texture Recognition Test. Two-way ANOVA, object effect: F(1,94) = 23.24; p < 0.0001; interaction effect: F(3,94) = 7.940; p < 0.0001. g Latency to fall in the accelerating rotarod task. Repeated measures ANOVA, group effect: F(3,26) = 4.039; p = 0.0175; time effect: F(2.461, 63.96) = 13.78; p = 0.0006. h Representative photomicrographs of coronal brain sections (Nissl staining) from 18-week-old WT-GFP, R6/1-GFP, WT-Foxp2 and R6/1-Foxp2 mice. Scale bar, 1000 µm. i Striatal volume in all experimental groups was measured. Two-way ANOVA, group effect: F(1,44) = 89.89; p < 0.0001. R6/1-GFP (n = 11); WT-GFP (n = 12), R6/1-Foxp2 (n = 13); WT-Foxp2 (n = 12). j Representative ventrobasal complex stained for cytochrome oxidase in 18-week-old WT-GFP, R6/1-GFP, WT-Foxp2 and R6/1-Foxp2 and mice. Scale bar, 200 µm. k Ventral posterior nucleus volume in all four groups was measured. Two-way ANOVA, group effect: F(1,21) = 9.812; p = 0.0050 and interaction effect: F(1,21) = 7.125; p = 0.0144. Data are means ± SEM. In f, g, WT-GFP (n = 14), R6/1-GFP (n = 11), WT-Foxp2 (n = 14) and R6/1-Foxp2 (n = 12). In h–k, WT-GFP (n = 8), R6/1-GFP (n = 5), WT-Foxp2 (n = 6) and R6/1-Foxp2 (n = 6). Tukey's post hoc test was used, **p < 0.01, ***p < 0.001 and ****p < 0.0001

