Fig. 5.
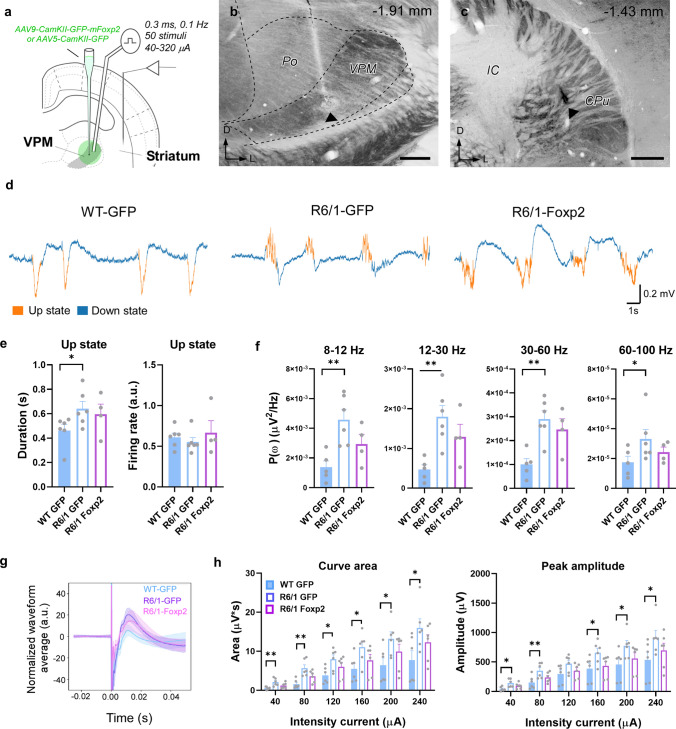
Effects on spontaneous activity and thalamo-striatal evoked responses upon Foxp2 levels recovery in the R6/1 mice thalamus. a Schematic representation of the experimental setup in a representative coronal section. Stereotaxic viral injections were performed bilaterally in the thalamus of 12-week-old mice to produce an overexpression of Foxp2. After four weeks of AAV expression, a bipolar stimulation electrode was placed in the thalamus to elicit striatal responses in the anesthetized 16-week-old mice. b, c Representative images of a coronal brain section counterstained with cytochrome oxidase showing the location of the bipolar electrode tip in VPM b and the tungsten electrode in the striatum c in a R6/1 mouse. Scale bars: 250 µm. The anteroposterior level respect to bregma is indicated in the upper right corner. Black arrowheads indicate the tip of the electrodes. d Spontaneous local field potentials (LFP) were recorded during slow oscillation activity in deeply anesthetized mice. Representative raw traces of the LFP in the three experimental groups (WT-GFP, R6/1-GFP and R6/1-Foxp2) are shown. Up and down events are colored in orange and blue, respectively. e Quantification of the Up states mean duration (in seconds; left panel) and the mean firing rate (arbitrary units; right panel) during the Up states. f Averaged power spectral density (PSD) over the z-scored normalized LFP of oscillatory activity at different frequency bands (alpha, 8–12 Hz; beta, 12–30 Hz; low-gamma, 30–60 Hz; high-gamma, 60–100 Hz) in WT-GFP, R6/1-GFP and R6/1-Foxp2 mice. g Representative normalized evoked responses in striatum after thalamic stimulation at 80 µA in WT-GFP (blue), R6/1-GFP (purple) and R6/1-Foxp2 (pink) mice. Solid lines indicate the trial-averaged waveforms while the shaded areas indicate the standard deviation from the mean. h The area under the curve (left panel) and the peak amplitude (right panel) were quantified for each current intensity tested, data in the range of 40–240 µA intensity currents are shown. Data are represented as mean ± SEM. Kruskal–Wallis test was used, *p < 0.05, **p < 0.01 compared with WT-GFP mice. Po posterior thalamic nucleus, CPu caudate putamen/striatum, IC internal capsule, VPM ventral posteromedial nucleus

