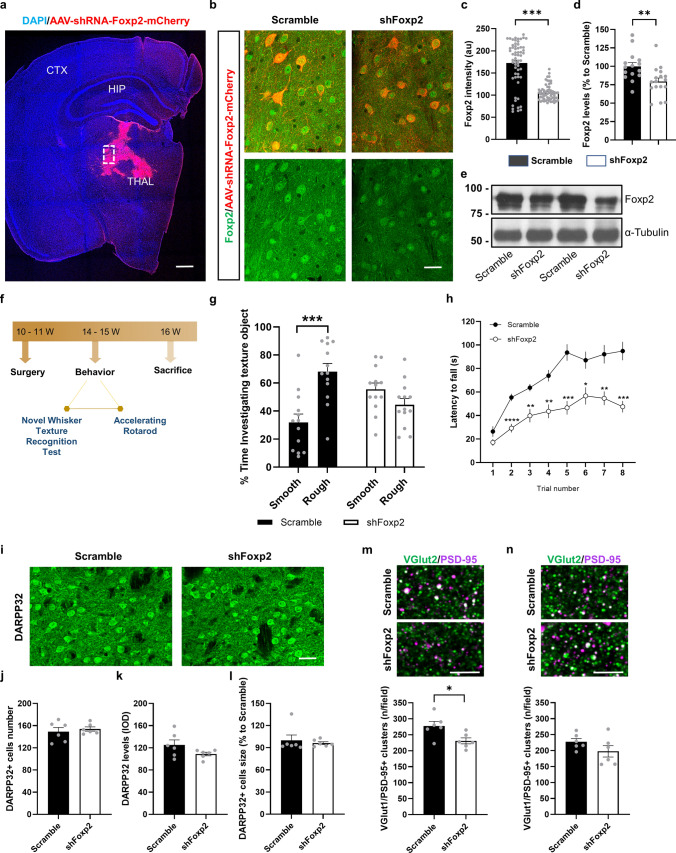
Fig. 8.
Behavioral assessment of sensory-motor disturbances in the WT-shFoxp2 mice. WT mice were injected in the thalamus with either, AAV-shRNAFoxp2-mCherry (shFoxp2 group) or AAV-Scramble-mCherry (Scramble group) viral constructs. a Distribution of transduced thalamus with AAV-shRNA-Foxp2-mCherry (in red) in a coronal brain section co-labeled with a DAPI staining (blue). Scale bar, 500 µm. b Representative photomicrographs illustrating high magnifications of inset from a showing Foxp2 (green) expression and localization in thalamic transduced neurons (in red). Scale bar, 25 µm. c Quantification of the Foxp2-positive integrated optical density (IOD, arbitrary units) in the nucleus of the transduced thalamic neurons as in b. Unpaired t-test; p < 0.0001. (n = 60 nuclei per group/10 nuclei per mouse/6 mouse per group). d Densitometric quantification of thalamic Foxp2 levels in Scramble and shFoxp2 mice. e Immunoblotting for Foxp2 and α-tubulin as a loading control. Data were normalized to tubulin. Unpaired t test; p < 0.006. f Timeline expressed in weeks (W) of behavioral testing in the Scramble and shFoxp2 groups of mice. g % Time investigating texture object in the Novel Whisker Texture Recognition Test was measured. Two-way ANOVA, object effect: F(1,48) = 5.734; p = 0.0206 and interaction effect: F(1,48) = 20.3; p < 0.0001. Scramble group (n = 13) and shFoxp2 group (n = 13). Tukey's post hoc test was used ****p < 0.0001 to compare % time exploring the rough vs the smooth textures in each group. h Latency to fall in the accelerating rotarod task in Scramble and shFoxp2 groups of mice was measured. Repeated measures ANOVA, group effect: F(1,31) = 28.16; p < 0.0001; and interaction effect: F(7,217) = 4.678; p < 0.0001. Scramble group (n = 13) and shFoxp2 group (n = 13). Bonferroni's post hoc test was used *p < 0.05, **p < 0.01, ***p < 0.001 and ****p < 0.0001 compared to Scramble mice. i Representative microphotographs of coronal sections from Scramble and shFoxp2 groups of mice immunostained for DARPP-32 in the dorsal striatum. Scale bar, 30 μm. j Number of DARPP-32-positive neurons/field. k DARPP-32 integrated optical density (IOD). l Soma size (µm2 relativized to the Scramble group) of DARPP-32-positive neurons. m Confocal images (upper panels) of a double PSD-95 (magenta) and VGlut2 (green) immunofluorescence in dorsal striatum of Scramble (upper image) and shFoxp2 (lower image) groups of mice. Scale bar, 6 μm. Quantification (lower graph) of the number of PSD-95/VGlut2-positive puncta (white) per field. Unpaired t test; p = 0.021. n Confocal image of a double PSD-95 (magenta) and VGlut2 (green) immunofluorescence in layer IV of the S1 cortex of Scramble (upper image) and shFoxp2 (lower image) groups of mice. Scale bar, 6 μm. Quantification (lower graph) of the number of PSD-95/VGlut2-positive puncta (white) per field. In i–n we analyzed 2 images per slice and 2 slices per mouse (Scramble (n = 6) and shFoxp2 (n = 6)). Data are means ± SEM in all experiments

