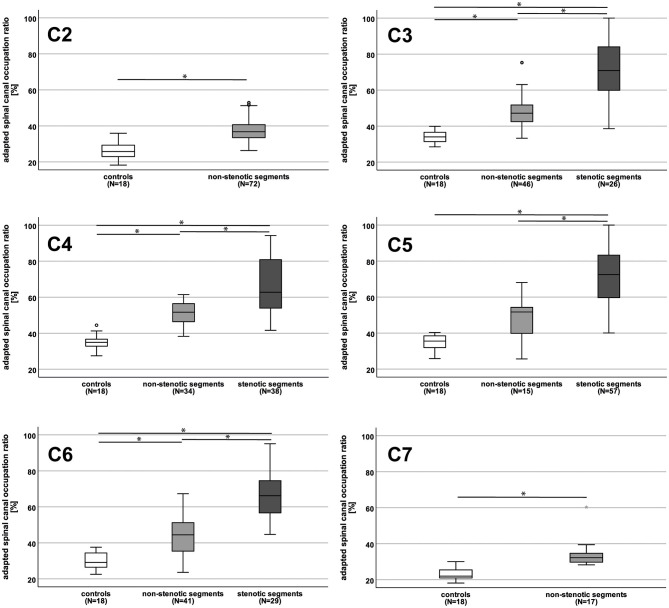
Figure 1.
Adapted spinal canal occupation ratio in controls and patients. The adapted spinal canal occupation ratio (aSCOR; %) was higher (reflecting accentuated spinal canal constriction) in patients (light gray boxplots = non-stenotic segments; dark gray boxplots = stenotic segments) compared to controls (white boxplots) in all cervical segments, but at C5 for not-stenotic segments. In patients, stenotic segments showed higher aSCOR values compared to non-stenotic segments in all segments. At C2 no stenosis could be observed in any patient, at C7 only anatomic measurements in not-stenotic segments were available. N, number of patients *p < 0.01.

