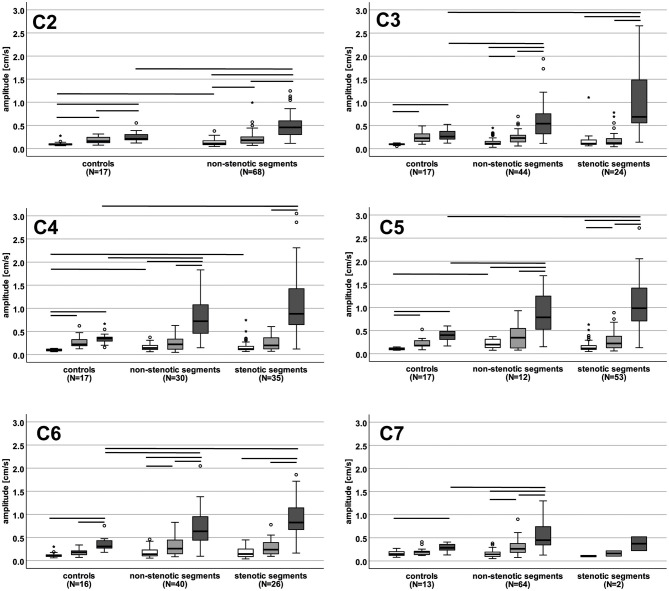
Figure 2.
Motion amplitude values in controls and patients in different spatial directions. The boxplots show the motion amplitude values (cm/s) for right-left (white), anterior-posterior (light gray) and cranio-caudal direction (dark gray) in controls (left), non-stenotic segments (middle) and stenotic segments (right) at each cervical segment. Horizontal lines represent significant differences (p < 0.05) between motion amplitudes within each group and between groups. N, number of patients.

