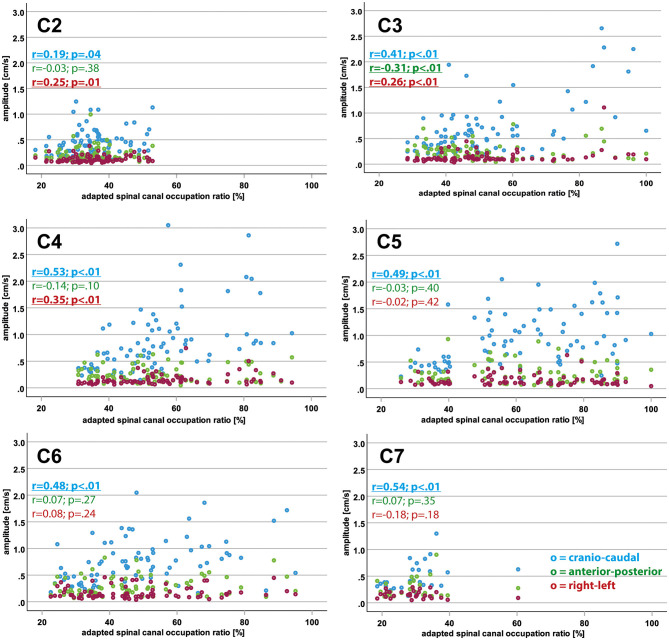
Figure 3.
Interrelation of motion amplitude and adapted spinal canal occupation ratio values in different spatial directions. The plots show the adapted spinal canal occupation ratio values (x-axis; %) in relation to the corresponding motion amplitude values (y-axis; cm/s) for cranio-caudal (blue), anterior-posterior (green) and right-left (red) direction in the entire population (controls and patients) for each cervical segment. Significant findings for Spearman rho coefficients (r) are displayed in bold letters and underlined.

