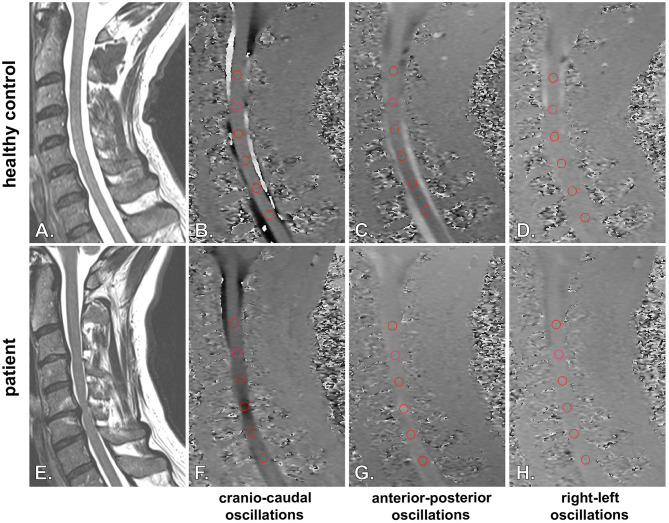
Figure 4.
Illustration of spinal cord oscillation measurements in healthy controls and patients. Spinal cord oscillations in cranio-caudal (B, F) (sagittal PC-MRI), anterior-posterior (C, G) (sagittal PC-MRI) and right-left (D, H) (sagittal PC-MRI) direction are illustrated for a healthy control (A: sagittal T2w; B–D: sagittal PC-MRI) and a patient (E: sagittal T2w; F–H: sagittal PC-MRI). Higher velocities in sagittal PC-MRI are encoded with darker (B, F: caudal; C, G: posterior; D, H: left) respectively brighter (B, F: cranial; C, G: anterior; D and H: right) colors. Velocities were assessed with a predefined round shaped region of interest placed onto the spinal cord at the correspondend intervertebral disc level (B–D and F–H; segments C2/3-C7/T1; red circles). The representative PC-MRI pictures illustrate the highest observed velocities within the cardiac cycle. In a healthy control (A–D) only moderate physiologic cranio-caudal and anterior-posterior oscillations could be observed, while right-left motion was marginal. In the DCM patient extensively increased cranio-caudal oscillations were observed at the cervical stenosis at segment C5/C6 (F), while anterior-posterior (G) and right-left oscillations (H) remained on low magnitudes.

