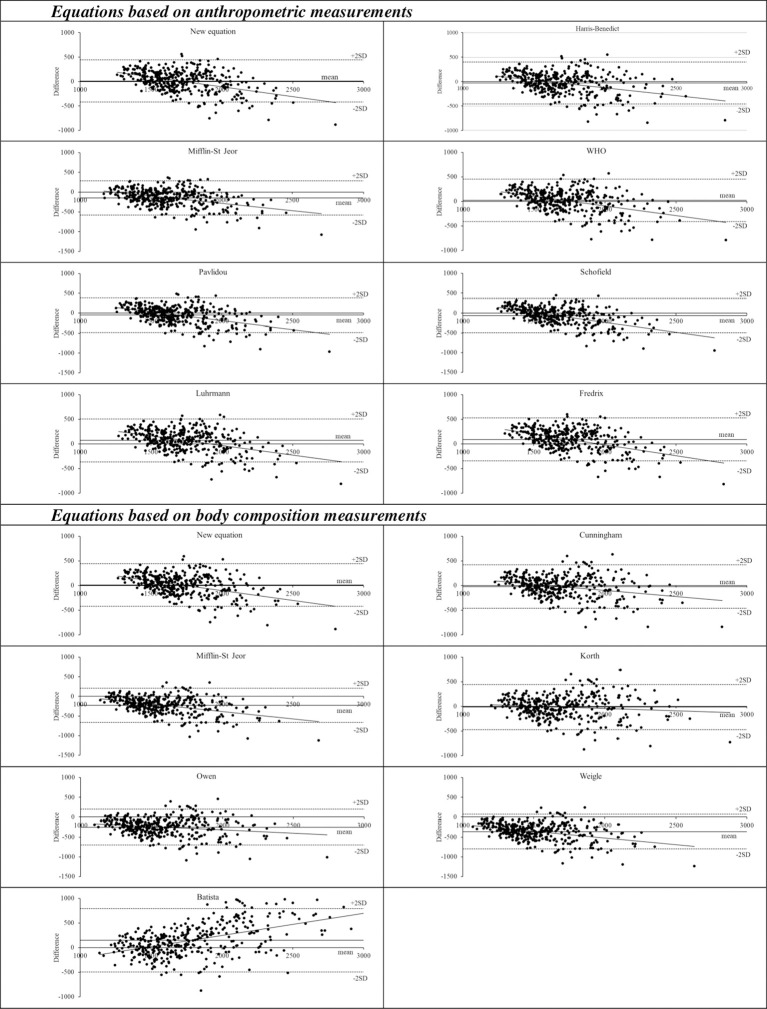
Figure 1.
Bland-Altman plots of energy expenditure measured by indirect calorimetry and predicted by fifteen tested equations. The dashed lines represent the mean difference between Resting Energy Expenditure (REE) predicted by each of the tested equations and REE measured by indirect calorimetry and ±1.96 standard deviations (SD) of the mean (limits of agreement), with a 95% confidence interval (dotted lines).

