
FIGURE 1.
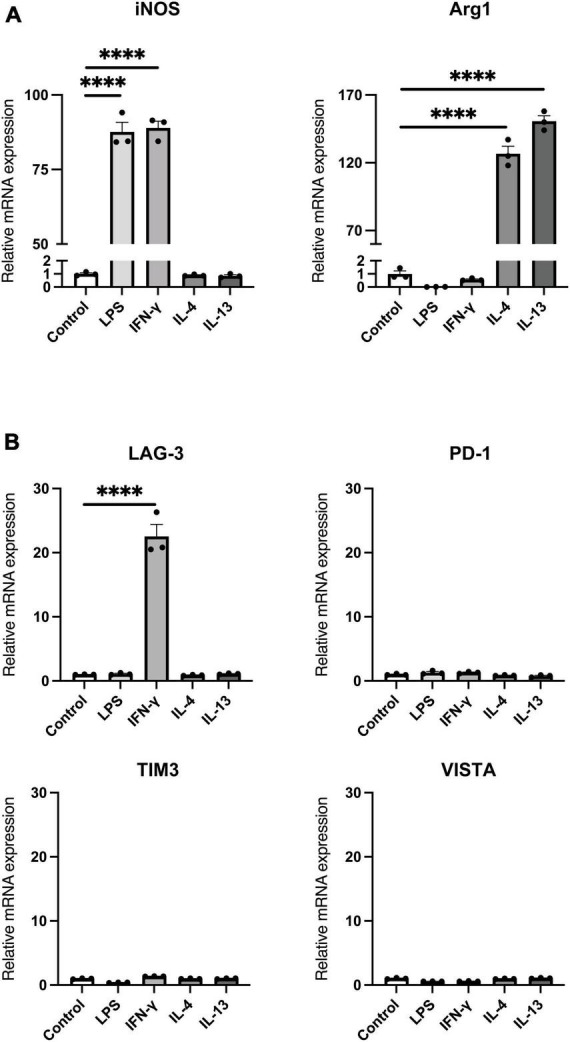
mRNA expression of immune checkpoint molecules in activated microglia. BV2 microglia cells were treated for 24 h with indicated stimulants, after which each mRNA levels were measured using quantitative real-time PCR. (A) mRNA expression of pro-inflammatory/anti-inflammatory activation markers. (B) Immune checkpoint molecule mRNA expression in activated microglia. Statistical analyses were performed using one-way ANOVA, followed by Dunnett’s post-hoc test; ****p < 0.0001. Error bars represent SEM.