FIGURE 5.
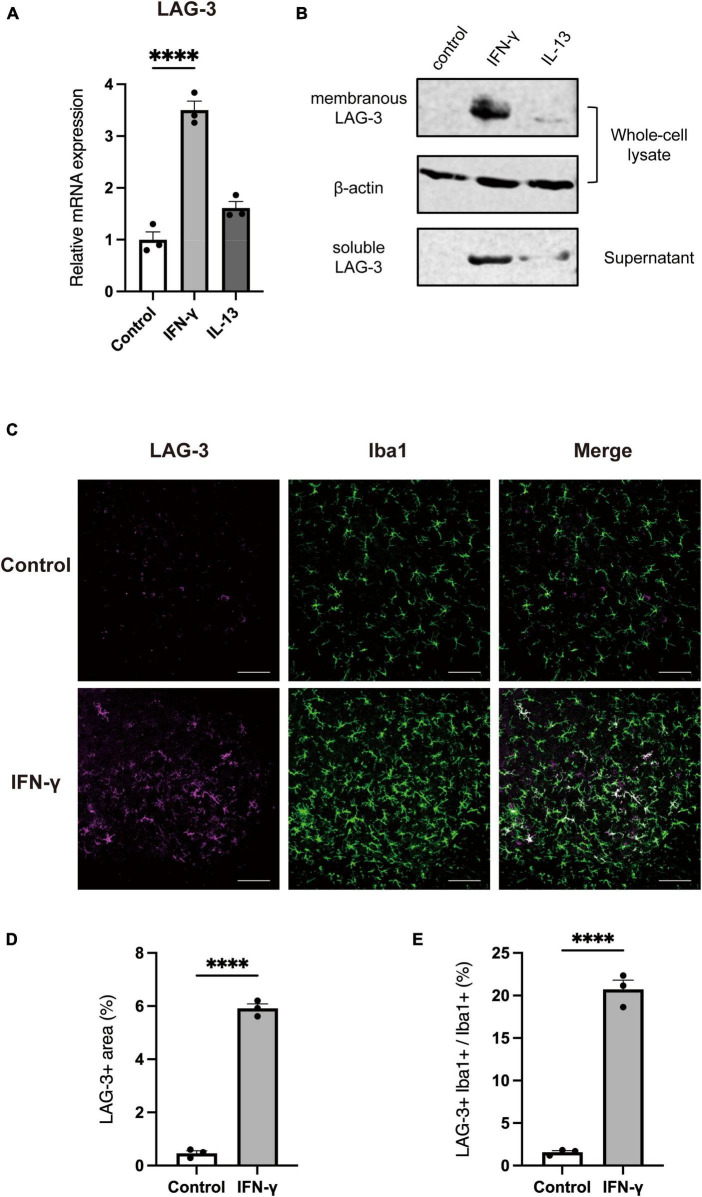
IFN-γ induces LAG-3 expression in primary cultured microglia and in vivo. LAG-3 expression was analyzed in stimulated primary microglia by (A) quantitative real-time PCR and (B) Western blotting. (C) Representative image of LAG-3 expression in mouse cervical spinal cord after intracisternal injection of IFN-γ (scale bar, 100 μm). (D,E) Quantification of LAG-3+ area and LAG-3+Iba1+/Iba1+ area (n = 3). Statistical analyses were performed using Student’s t-test or one-way ANOVA, followed by Dunnett’s post-hoc test; ****p < 0.0001. Error bars represent SEM.

