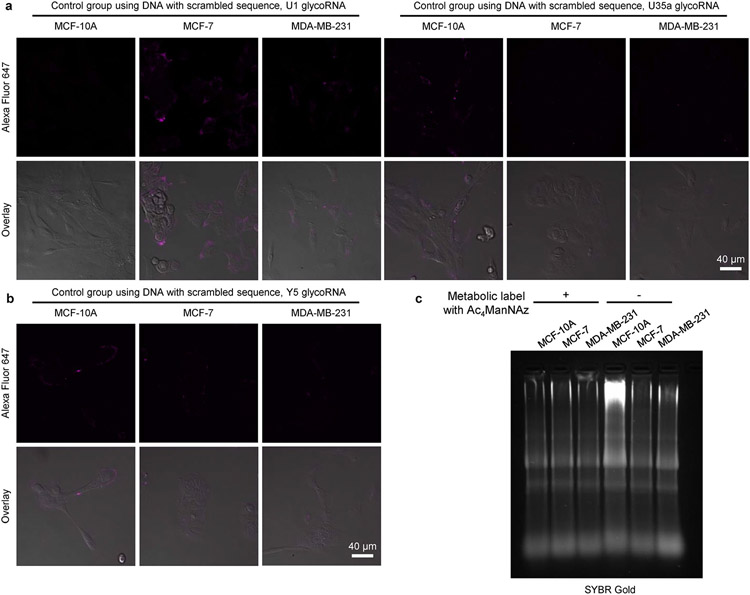
Extended Data Fig. 5 ∣. Visualization of glycoRNAs in malignant transformation using ARPLA, related with Fig. 4.
(a,b) CLSM images of MCF-10A, MCF-7, MDA-MB-231 cells in control groups using DNA with scrambled sequences. (c) Agarose gel electrophoresis image of total RNA from MCF-10A, MCF-7, MDA-MB-231 cells. These cells were treated with Ac4ManNAz for 48 h before RNA extraction. All experiments were repeated independently 3 times with similar results.

