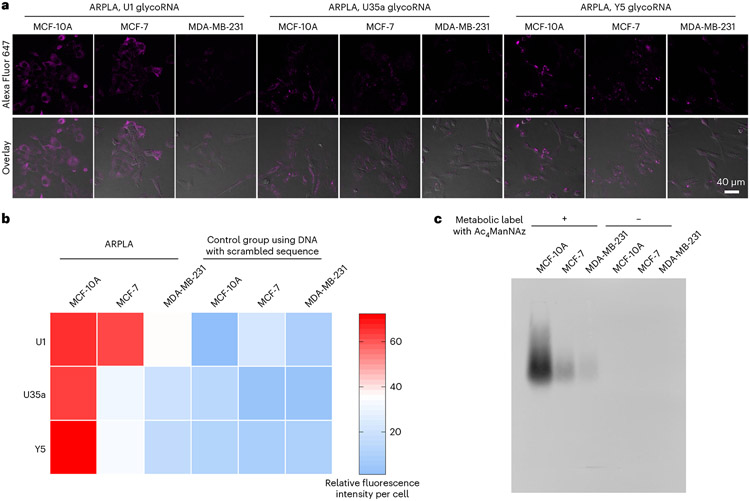
Fig. 4 ∣. Visualization of glycoRNAs in malignant transformation using ARPLA.
a, CLSM images of U1, U35a and Y5 glycoRNAs by ARPLA in MCF-10A, MCF-7 and MDA-MB-231 cells. b, Heat map and quantitative analysis of relative fluorescence intensity in a and Extended Data Fig. 7a,b; n = 3 biological replicates. c, Total glycoRNA expression levels in MCF-10A, MCF-7 and MDA-MB-231 cells evaluated by RNA blotting. GlycoRNAs were metabolically labeled by Ac4ManNAz. The cell imaging experiments and RNA blotting assays were repeated three times independently with similar results.

