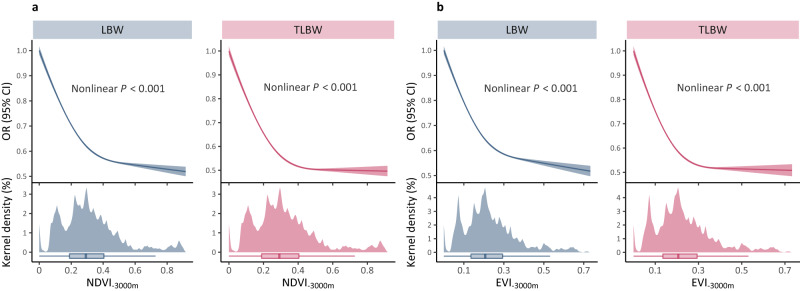
Fig. 3. Exposure–response curves for greenness-LBW/TLBW associations.
Relationships between LBW/TLBW and NDVI (a) or EVI (b) within a 3000-m buffer. The curves stemmed from the fully adjusted model (including maternal demographic characteristics, fetal variables, and environmental factors) are fitted using restricted cubic splines function with three knots placed at the 10th, 50th, and 90th percentiles of greenness exposure distribution. The solid lines in the upper panels represent the point estimates of LBW/TLBW risks compared to 0, while the shaded bands represent their 95% confidence intervals. In the lower panels, we have displayed the kernel density curves and box plots to illustrate the distributions of NDVI and EVI exposures. In the box plots, the center bars are medians; the box bounds indicate ranges from 25th to 75th; whiskers refer to minima and maxima, and extreme values beyond the 75th percentile plus 1.5 times IQR are not displayed. The nonlinear is examined by likelihood-ratio test, and statistical tests are two-sided. OR odds ratio, CI confidence interval, LBW low birth weight, TLBW term low birth weight, NDVI normalized difference vegetation index, EVI enhanced vegetation index.

