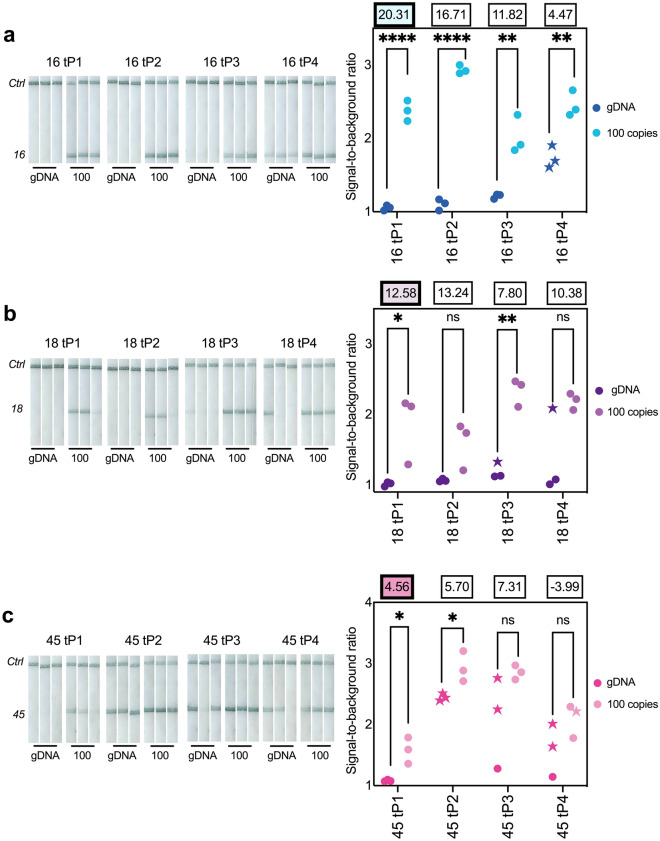
Figure 2.
RPA tailed primer screens. Lateral flow strips (left) of RPA products from tailed primers designed for (a) HPV16, (b) HPV18, and (c) HPV45. Signal-to-background ratio (SBR) from each strip (right) and mean relative amplification yield (n = 9; three RPA replicates x three technical replicates) are displayed above each primer pair. Starred replicates indicate nonspecific products, confirmed by melt curve analysis, which produced a positive visual signal. Tailed primer pairs chosen for further assay development are highlighted. *p < 0.05; **p < 0.01; ***p < 0.001; ****p < 0.0001; ns = not significant; significance determined for each primer pair by a two-tailed unpaired t-test.

