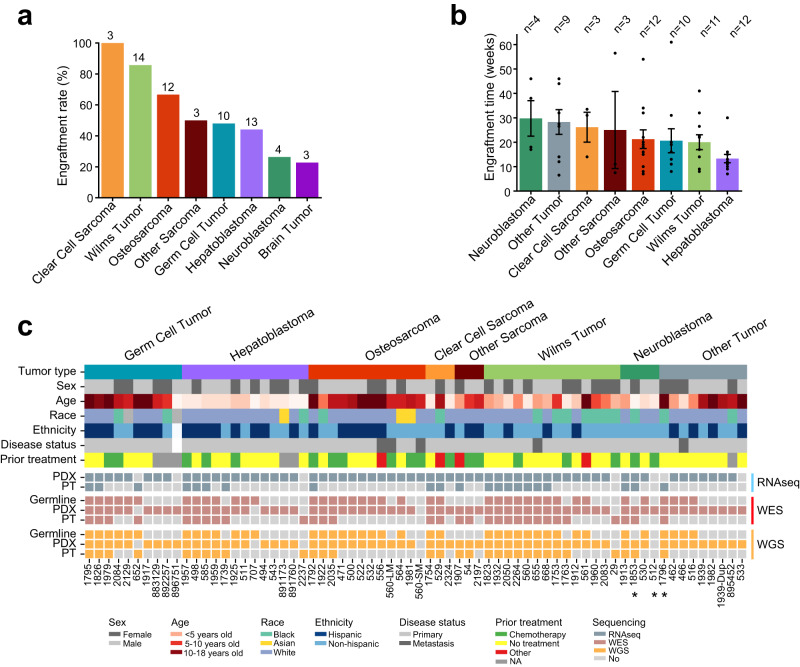
Fig. 1. Overview of PDXs and sequencing data.
a Engraftment rate across cancer types. The number above each bar indicates the number of PDXs analyzed in this study. b Average engraftment time. The error bar indicates standard error of the mean. c Overview of clinical and molecular data. The top panel shows clinical data including cancer type, stage, sex, age, race, ethnicity, and treatment. The bottom panel summarizes the sequencing data. Samples with an asterisk were removed from data analyses because of high mouse tissue contamination. RNAseq, RNA sequencing; WES, whole exome sequencing; WGS, low pass whole genome sequencing. Source data are provided as a Source data file.

