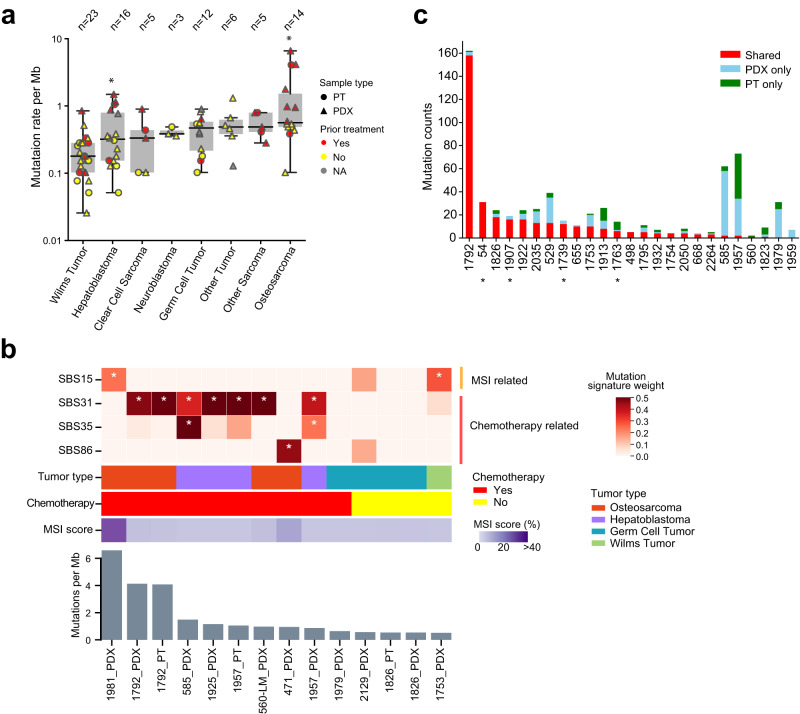
Fig. 2. Mutation rates and mutational signatures.
a Distribution of somatic mutation rate. Each dot represents a sample (circle, PT; triangle, PDX). The boxes and middle lines within depict the interquartile range (IQR) and median. The top and bottom whiskers represent values within 1.5×IQR of the upper and lower quantiles, respectively. In hepatoblastoma and osteosarcoma, samples with prior treatment show higher mutation rates than samples without (asterisk, p < 0.05, two-sided Wilcox rank sum test). Other tumor types either show no statistical significance (p > 0.05, Wilms tumor and germ cell tumor) or were not compared due to limited sample sizes. b Distribution of MSI and chemotherapy related mutational signatures across samples. The heatmap on top reflects the weight of selected mutation signatures. Clinical data and MSI score are shown below the heatmap. Bar plot at the bottom illustrates mutational load of each sample. Samples are ordered by mutation load. Asterisks indicate weight greater than 0.25. c Mutational similarity between PTs and PDXs. Patients are ordered by the total number of shared mutations. Samples labeled with asterisk do not have the matched germline. Source data are provided as a Source data file.

