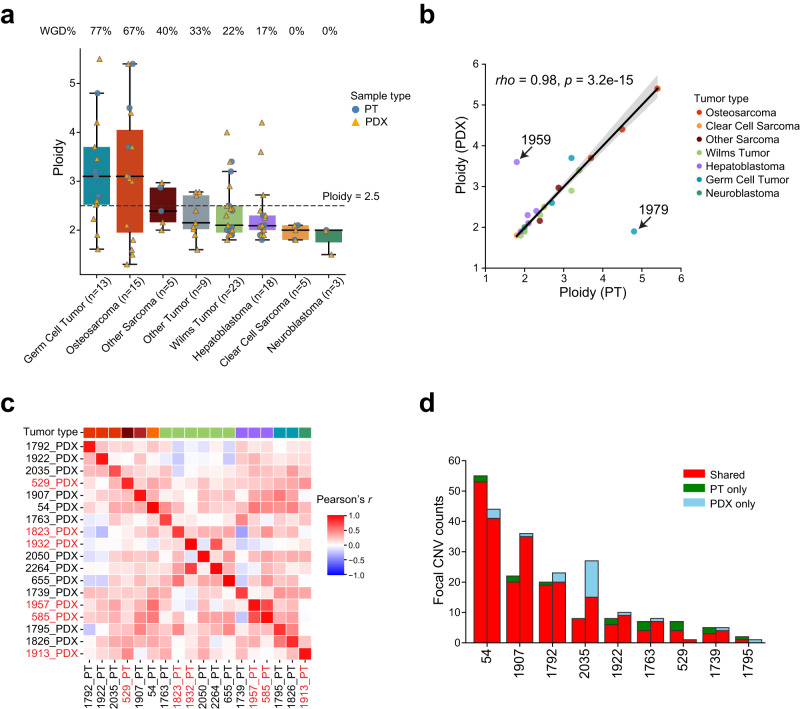
Fig. 5. Conservation of somatic copy number alterations (SCNAs) in PDXs.
a Distribution of tumor ploidy. Tumors with a ploidy higher than 2.5 (dashed line) are considered whole genome doubling (WGD). Each dot represents a sample (circle, PT; triangle, PDX). The boxes and middle lines within represent the interquartile range (IQR) and median. The top and bottom whiskers represent values within 1.5×IQR of the upper and lower quantiles respectively. b Ploidy correlation between PT and PDX. Each dot represents a pair. The correlation coefficient and p-value were calculated with Spearman’s rank correlation test. Black solid line is the linear regression line, and the error band corresponds to 95% confidence interval. The two outliers (1959 and 1979) were excluded from the regression and correlation analyses. c Pairwise correlation in copy number profiles between PTs and PDXs based on 1 Mb windows. The top color bar indicating tumor type is interpreted the same as in (b). Samples labeled in red are from group 2. d Overlaps of focal SCNAs. For each patient, the left bar presents the PT and the right bar represents the PDX. Counts of shared events are different in PT and PDX because of variations in segmentation boundaries. Only the nine PT/PDX pairs where focal SCNAs were found are shown. Source data are provided as a Source Data file.

