
Fig. 2. SDS- and DPC-induced large oligomers have the same structure.
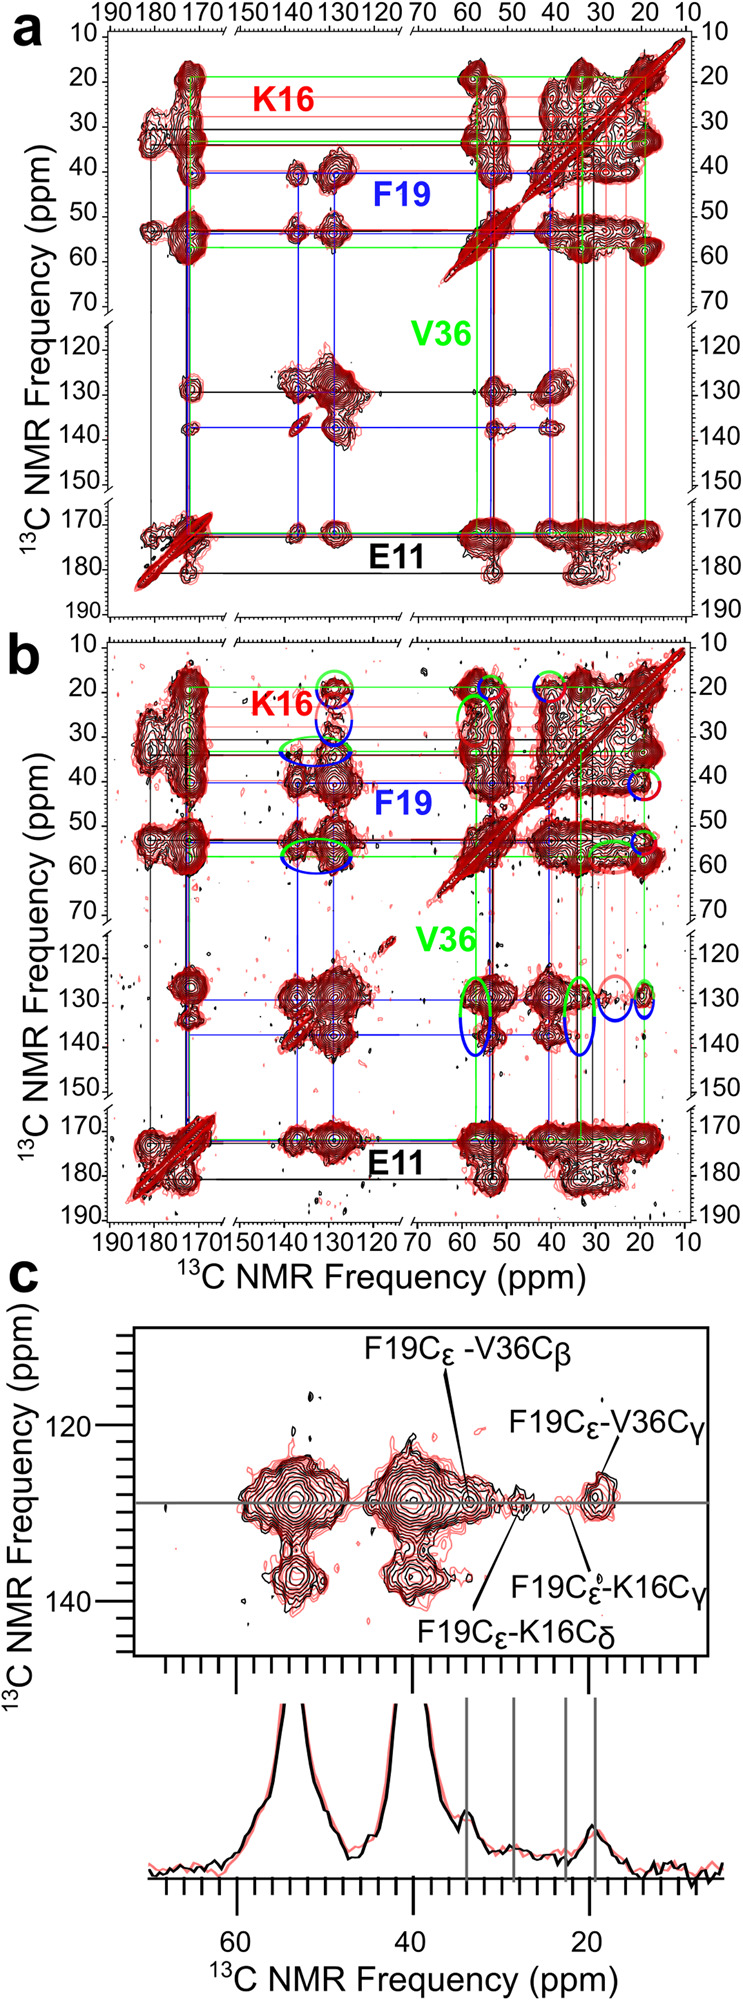
a Overlaid 13C-13C correlation spectra of SDS- and DPC-induced oligomers (black and red contours, respectively), acquired at a 50 ms mixing time on samples with uniform 13C-labeling at Glu11, Lys16, Phe19, and Val36. The colored lines indicate peaks connected by intra-residue 13C-13C couplings. b Overlay of the correlation spectra acquired on the same samples but with a 500 ms mixing time. The multi-colored ovals indicate crosspeaks corresponding to 13C atoms on different residues. The spectrum of the SDS-induced 150-kD oligomer (black contours) was published previously21. c A zoom highlighting the crosspeaks of Phe19 aromatic carbons with Lys16 and Val36 aliphatic carbons, along with a 1D slice illustrating the close match of the two spectra.