
Fig. 5. Expression of Gag WT and WM mutant caused a reorganization of SM-rich domains in the PM.
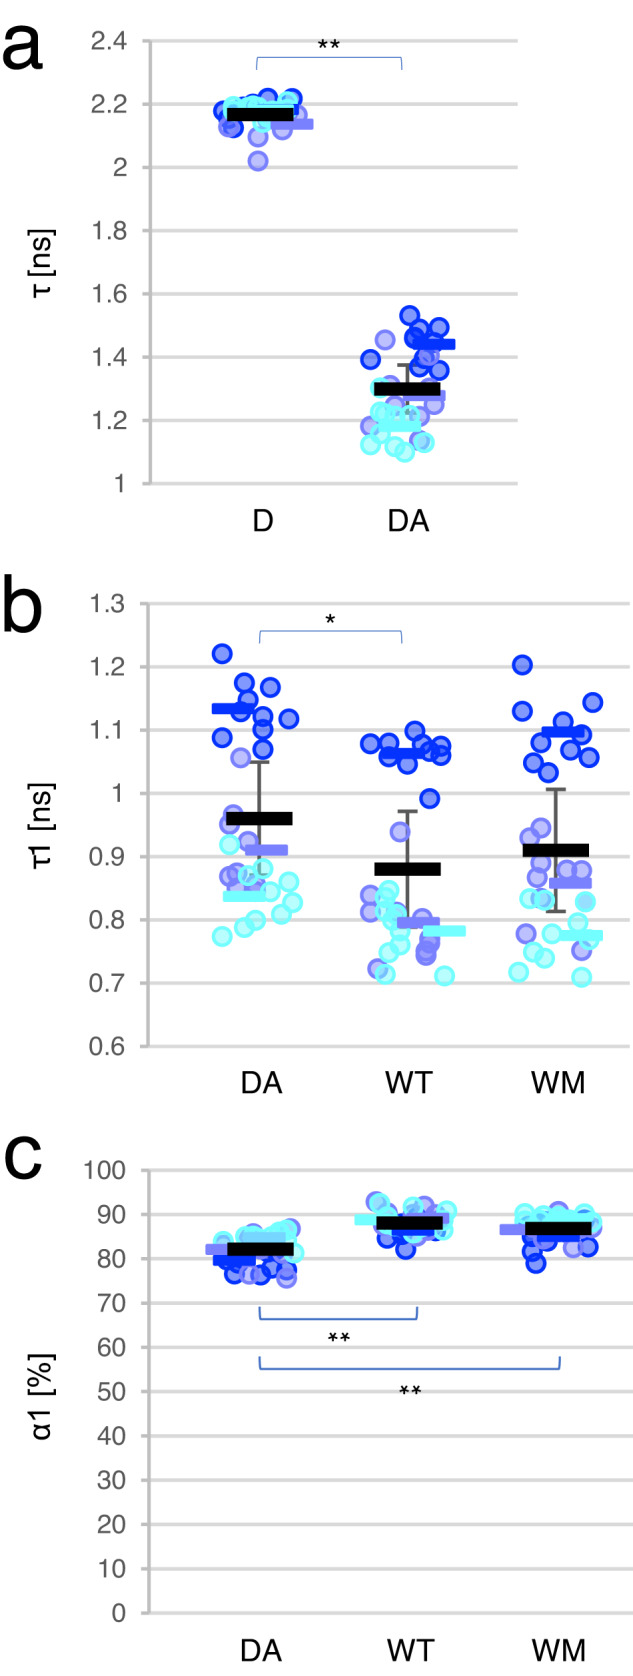
a Lifetime distribution in the cell labeled with EGFP-NT-Lys (donor, D) and EGFP-NT-Lys and mCherry-NT-Lys (acceptor) (DA) in FLIM-FRET. The results of the single-component analysis were shown. b, c Lifetime τ1 (b) and amplitude α1 (c) distribution in the two-component analysis of cells doubly labeled with EGFP-NT-Lys and mCherry-NT-Lys. DA, WT, and WM indicate cells without and with Gag WT and Gag-WM expression, respectively. The value in each cell, the mean in each experiment, and the mean ± SEM in the three independent experiments are shown as dots and bars in three different blue colors, and a black bar and error bar, respectively (n = 30 except for DA in which n = 29 over three experiments). The two-tailed paired t-test is applied on (a) and the one-way ANOVA post-hoc Tukey test on (b) and (c). * and ** indicate significant differences at the significance level of 0.05 and 0.01, respectively. Source data and detailed statistics were provided as a Source Data file.