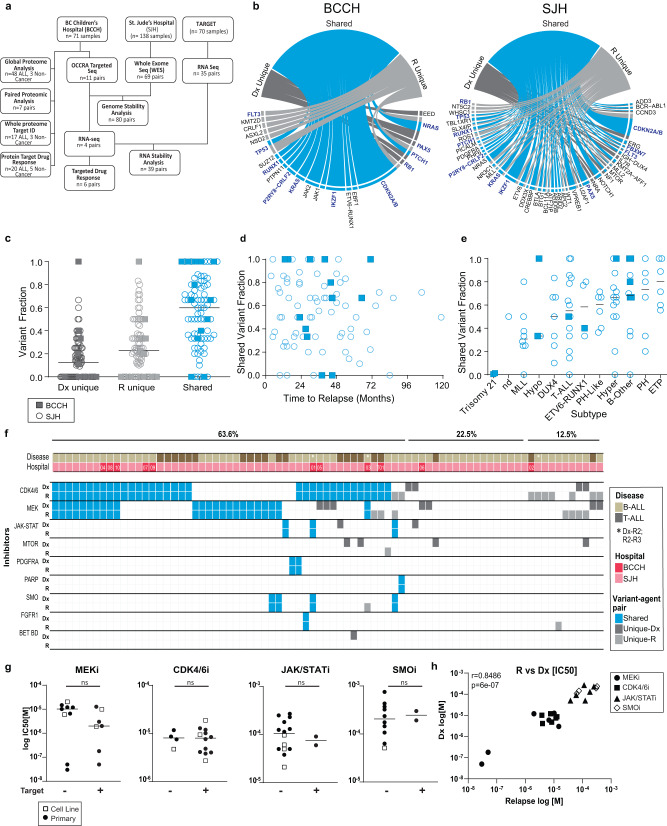
Fig. 1. Stability of affected genes and targeted drug response through ALL disease progression.
a Flow-chart depicting the number of samples from each cohort that were included for each analysis. b Circos plot for all mutations identified in the BCCH and SJH cohorts demonstrating mutations that were Dx unique (dark gray), R unique (light gray), or shared between Dx and R samples (blue). Genes in blue text indicate genes with detected lesions in both cohorts. c Fraction of variants identified as D unique, R1 unique, or shared within paired samples sourced from 80 ALL patients (n = 11 patients from BCCH represented by squares, n = 69 patients from SJH represented by circles). The black bar represents the median of the population. d Dot plot for fraction of shared variants versus time to relapse for 80 ALL patients (n = 11 patients from BCCH represented by squares, n = 69 patients from SJH represented by circles). e Dot plot for fraction of shared variants separated by disease subtype for 80 ALL patients (n = 11 patients from BCCH represented by squares, n = 69 patients from SJH represented by circles). The black bar represents the median of the population. f Predicted sensitivity to targeted agents in paired Dx-R samples (or Dx-R2, R2-R3 indicated by an asterisk) taken from 80 ALL patients treated at BCCH (n = 11 patients, red) or SJH (n = 69 patients, dark pink). B-ALL (light brown) and T-ALL (dark brown) samples are indicated. Shared variants (blue), Dx unique variants (dark gray), or R unique variants (light gray) are indicated. Agent-variant pairs were assigned following the strategy outlined in the Pediatric Match Trial9. g Dot plots for IC50 [µM] values measured for primary samples or cell lines for each of four inhibitors. Measurements represent the mean of n = 2 replica wells from a single experiment. Samples are separated based on the presence or absence of a genomic variant predicted to augment drug sensitivity (ns= not significant by unpaired, two-sided t-test). h Correlation of IC50 [M] values measured for paired Dx and R samples. Individual drugs are indicated by unique identifiers. r = Pearson correlation coefficient.

