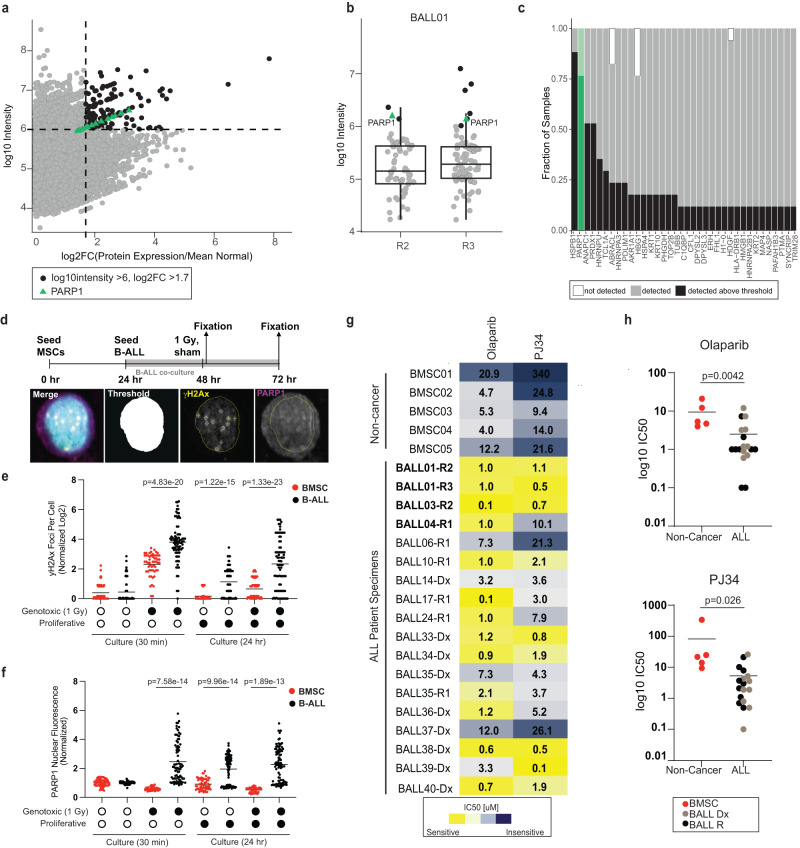
Fig. 4. Whole proteome discovery-driven analysis identifies pan-ALL protein targets.
a Correlation of log2 fold-change (FC)/non-cancer vs protein abundance for all proteins in samples from the paired Dx-R dataset. Dashed lines represent cut-offs for top five percent of the population. Proteins that meet both cut-offs are black and PARP expression is represented by green triangles. b Representative figure showing all proteins that are >log2FC of 1.7. Only the proteins that have log10 intensity >6.0 (top 5%) are in green. n = 1 experiment from the two samples of patient BALL01. Box represents the IQR, the middle line represents the median and the whiskers extend to 1.5 × IQR. c All proteins of interest plotted by percentage of samples the protein meets the indicated parameters (black), was identified but not meeting the parameters (gray) or not detected (white). PARP1 is highlighted in green. d Experimental timeline and protocol (above) with image analysis pipeline (below) for primary B-ALL and BMSC cocultures followed by immunofluorescence analysis to quantify γH2Ax foci per cell and PARP1 nuclear fluorescence. e Log2 γH2Ax foci per cell normalized to sham treatment at 30 min, quantified from immunofluorescence analysis of 2 BMSC (red) samples and 3 B-ALL (black) samples (n = 30 cells per sample). Significance is assigned by unpaired, two-sided Welch’s t-test. f Average PARP1 nuclear fluorescence per cell normalized to sham treatment at 30 min, quantified from immunofluorescence analysis of 2 BMSC (red) samples and 3 B-ALL (black) samples (n = 30 cells per sample Significance is assigned by unpaired, two-sided Welch’s t-test. g Measured IC50 values for Olaparib or PJ34 measured against ALL or non-cancer samples from patients treated at BCCH (n = 5 non-cancer, 8 diagnostic samples, 10 relapse samples). IC50 [µM] are colored by most sensitive in yellow to least sensitive in blue. Measurements represent the mean of n = 2 replica wells from a single experiment. Bolded Patient IDs indicate patient samples analyzed in the pan-ALL target proteomic analysis. h Dot plots for IC50 [µM] values for Olaparib or PJ34 measured against non-cancer specimens (n = 5) (red), primary diagnostic specimens (n = 9) (light brown) or primary relapse specimens (n = 9) (black). Points represent the mean of n = 2 replica wells from a single experiment for each specimen. Significance is assigned by unpaired, two-sided student’s t-test.

