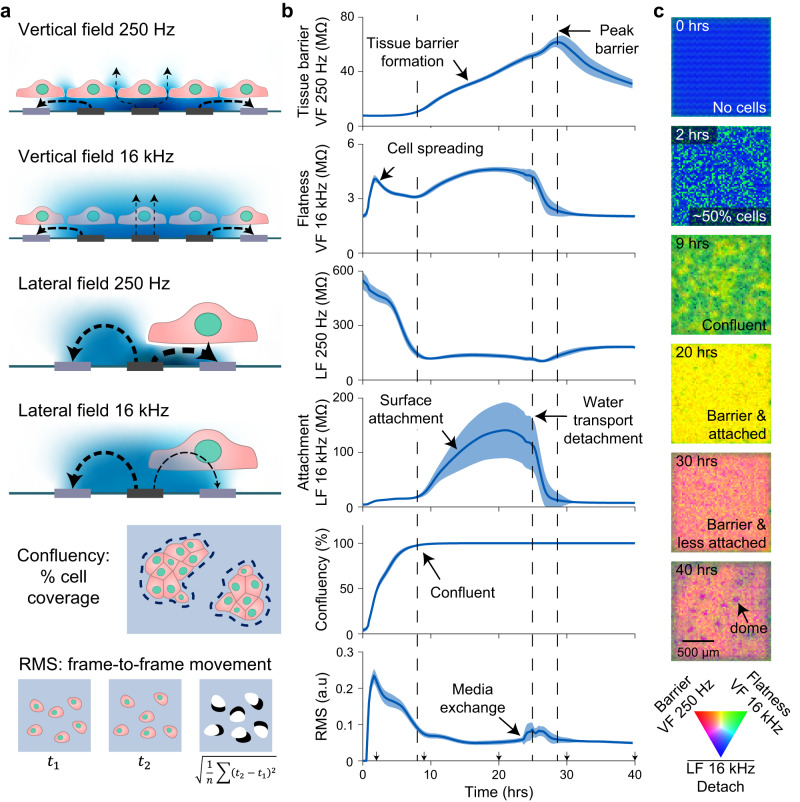
Fig. 2. Real-time, label-free field-based impedance measurements for live-cell functional morphology measurement.
a Schematics for the vertical field (VF) and lateral field (LF) configurations, confluency, and root mean square (RMS). Examples of measured electric field lines are shown between stimulation (dark gray) and return electrodes (light gray) and potential distribution in blue. At low-frequency (250 Hz), cell membranes block the electric fields whereas at higher frequency (16 kHz) the fields become more proximately sensitive. Confluency and RMS are calculated from the impedance images. b Parameter traces are shown for MDCK cells (canine kidney) plated on a 96-well CMOS microplate. Cells were seeded at time t = 0 hrs at a density of 40,000 cells/well and measured for 40 hrs. Media was changed at 24 hrs post seeding. The traces represent mean ± s.d. for 88 wells across the plate. The most representative biological parameter is labeled for each measurement, but a blend of biological parameters contributes to each measurement in total. Source data are provided as a source data file. c Impedance images of the MDCK cells from a single well at the indicated time points. The images were generated with VF 250 Hz in red, VF 16 kHz in green, and the inverse of the LF 16 kHz in blue.

