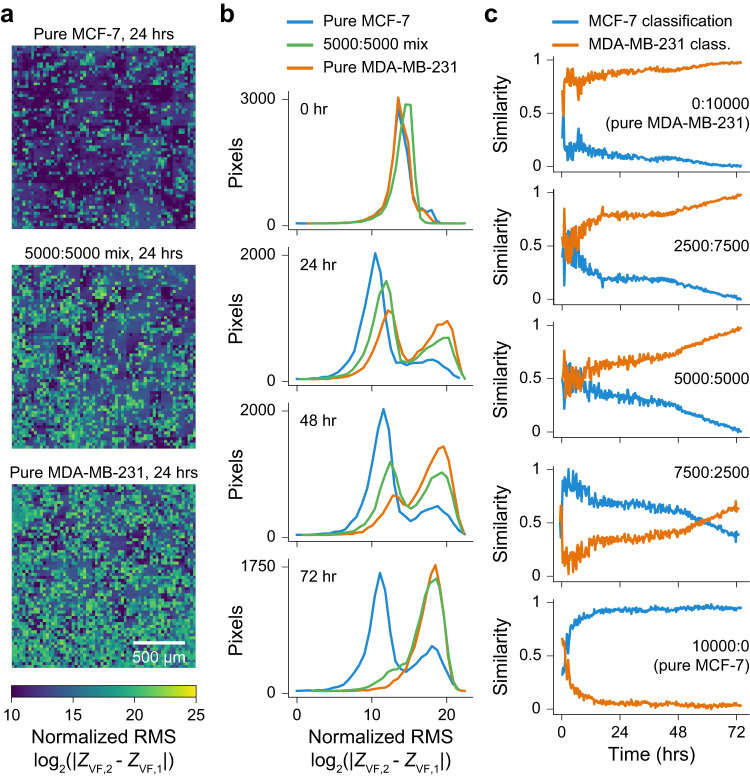
Fig. 4. Measurement of heterogeneity in mixed populations of epithelial and mesenchymal cell types.
a Normalized RMS impedance images for pure MCF-7 cells (epithelial phenotype), a 1:1 mixture of MCF-7:MDA-MB-231, and pure MDA-MB-231 cells (mesenchymal phenotype). Dark blue values of low RMS indicate low motility/movement, while green/yellow regions of high RMS indicate high motility/movement. b Distributions of normalized RMS across the 4096 pixels per well for MCF-7 cells (blue), 5000:5000 MCF-7:MDA-MB-231 (green) and MDA-MB-231 cells (orange) at time points from 0 to 72 h. The mixed population gradually transitions towards the pure MDA-MB-231, attributed to an increased growth rate of the MDA-MB-231 over the MCF-7 cells within the co-culture. c Graphs show the predicted percentage of MCF-7 (blue) and MDA-MB-231 (orange) cells over time for various co-culture ratios. The gray overlay indicates the model is not predictive until +5 h after plating (as determined by the pure population tests). Source data are provided as a source data file.

