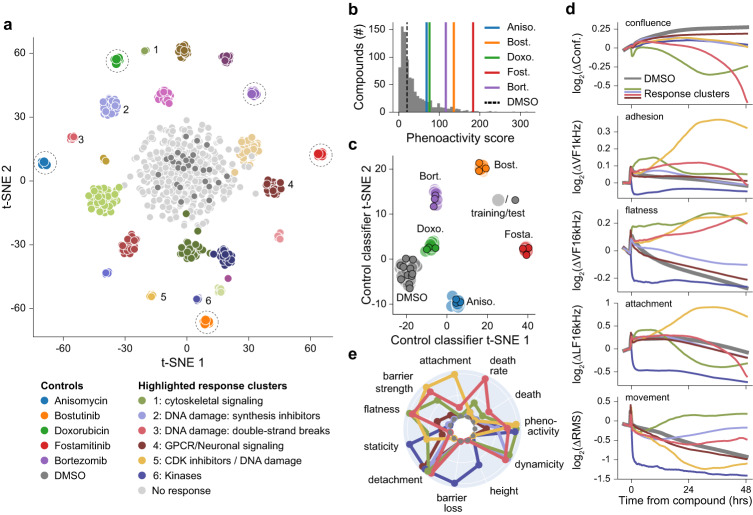
Fig. 6. A proof-of-concept screen of 904 compounds using 13× semiconductor 96-microplates to perform high-dimensional profiling and MOA identification.
a A549 (lung/alveoli) cells were treated with a library of 904 compounds at a concentration of 10 μM. A linear discriminate analysis (LDA) and a t-distributed stochastic neighbor embedding (t-SNE) model identified 25 distinct clusters using the high-dimensional impedance measurements. The legend indicates key highlighted clusters (numbered from 1–6) and positive control compounds (indicated with dashed circles). b Compound phenoactivity scores characterize the extent of measured activity; 600 compounds exhibited phenoactivity separated from the DMSO negative controls, indicated by dotted line. Positive controls are displayed using colored vertical lines for reference. c A t-SNE plot showing the output of training and test data of a LDA based model for classifying control compounds. The 13 plate replicate data set was divided into a training set (filled circles) and test set (outlined circles). The test set was classified with a precision score of 1, indicating distinct and separable responses. d Time traces for the indicated measurements for numbered clusters from (a) across selected impedance measurement parameters. e Radar plots comparing 11 bio-basis for numbered clusters from (a) the radial axis is scaled from 0-1. Source data are provided as a source data file.

