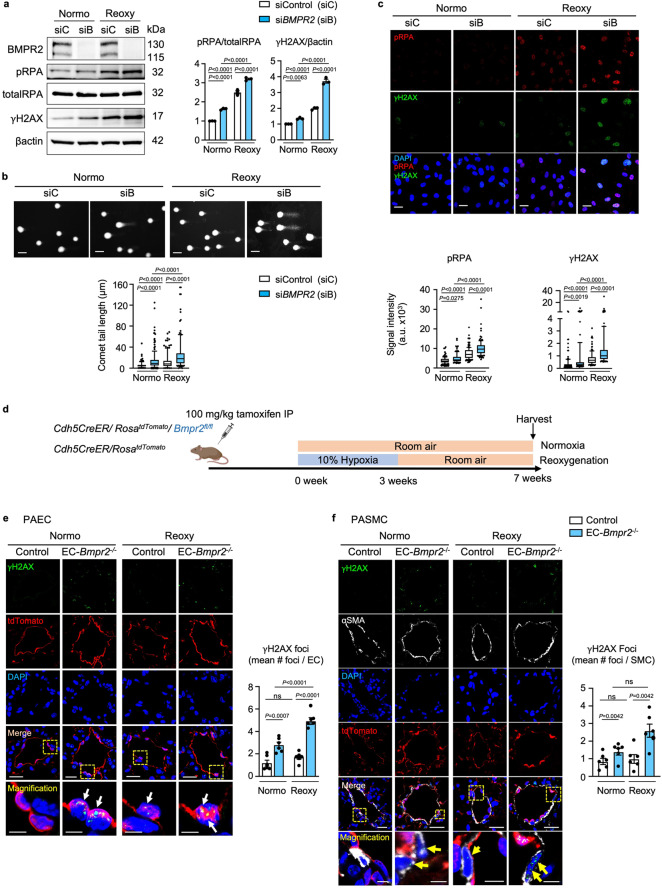
Fig. 1. Loss of BMPR2 results in accumulation of DNA damage in normoxia and after reoxygenation, in cultured cells and in mice with EC-Bmpr2-/-.
a–c Commercially available PAEC transfected with scrambled control siRNA (siC) or siRNA targeting BMPR2 (siB) were cultured under hypoxia (0.5% O2) for 48 h followed by room air for 24 h (reoxygenation, reoxy), or room air for 72 h (normoxia, normo). a Representative immunoblots of DNA damage markers γH2AX and phosphorylated (p)RPA. n = 3 individual experiments. Bars = mean ± S.E.M. P values determined by 2-way ANOVA with Holm-Sidak posthoc test. b Comet assay shows DNA damage, reflected by comet tail length. Scale bar, 20 µm. n = 119, 166, 123, 141 cells for siC normoxia, siB normoxia, siC Reoxy, siB reoxy respectively. c Representative immunohistochemistry of DNA damage markers. Scale bars, 20 μm. n = 115, 117, 149, 120 cells for siC normoxia, siB normoxia, siC Reoxy, siB Reoxy, respectively. In (b, c), box bounds, 25th and 75th percentiles, whiskers 10th to 90th percentiles and box centre shows the median. P values were determined by the Kruskal-Wallis ANOVA test with Dunn’s test. This experiment was repeated 3 independent times with similar results. d Mouse model: Bmpr2 was deleted in EC by injecting tamoxifen to Cdh5CreER/ RosatdTomato/Bmpr2fl/fl mice (EC-Bmpr2-/-), bred as in Methods. Cdh5CreER/RosatdTomato mice were used as controls. Mice were exposed to hypoxia (10% oxygen) for 3 weeks followed by 4 weeks of room air (reoxy), or maintained in room air for 7 weeks (normo). Schema created with BioRender.com. e γH2AX immunofluorescence foci in PAEC of control and EC-Bmpr2-/- mice (arrows). Scale bars, 20 μm. Bottom panels: magnified merged image of the area delineated by the dotted line. Scale bars, 5 μm. f Mean number of γH2AX immunofluorescent foci in PASMC of control and EC-Bmpr2-/- mice (arrows). 100–200 μm vessels were examined since control mice had little distal arterial muscularization. αSMA indicates SMC. Scale bars, 20 μm. The bottom panels show magnified merged image of the area delineated by the dotted line. Scale bars, 5 μm. In (e, f): Data shown as mean ± S.E.M., n = 6 mice per group, with 5 vessels analyzed per mouse. P values determined by 2-way ANOVA with Holm-Sidak posthoc test. ns, not significant. Source data are provided as a Source Data file.

