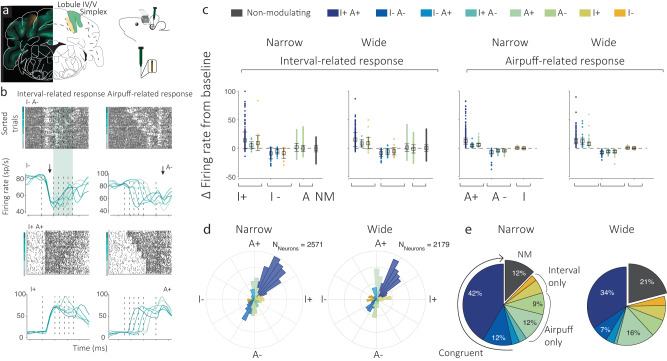
Fig. 2. Classification of neural responses.
a Recordings were made with a grid-in-chamber setup in head-fixed animals. Probe entry locations as marked with DiI at grid point epicenter on the last day of recording. b Classification of neurons based on prior-related and airpuff-related responses. PSTHs or rasters are aligned to either epoch. A classification technique that quantified firing rates in each epoch with respect to baseline firing rate determined whether the neuron significantly responds to either epoch and in which direction. I indicates interval or ISI-related activity, A indicates Airpuff-related activity and + and − signs indicate facilitation and suppression, respectively. c Relative firing rate of each functional class with respect to baseline. Dots represent individual neurons (total Nnarrow = 2571, Nwide = 2179). Boxes represent averages. Error bars indicate standard error of mean. Dashed line indicates no change from baseline. NM stands for non-modulating. d Polar histogram exhibiting functional heterogeneity in recorded cerebellar cortical neurons for the Narrow (left) and Wide (right) condition. Classification of Purkinje cells based on their response to the ISI epoch (I+ or I−) and Airpuff epoch (A+ or A−). e Relative proportion of each functional class among recorded neurons for the Narrow (left) and Wide (right) conditions. Congruent conditions (I+A+ and I-A−), Interval only (I+ I−), and Airpuff only (A+ A−) are marked. Incongruent conditions, I+A- and I-A+ (light blue colors) are not labeled. Colors indicate functional classes in the same manner as the legend in c.

