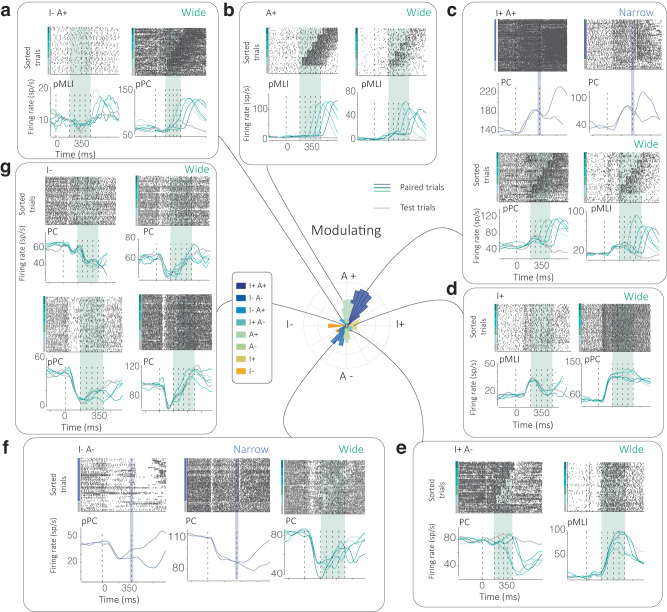
Fig. 3. Neural activity profiles for various functional classes.
a–g A polar histogram, indicating the various functional classes identified in an individual, is presented at the center with dark blue-orange colors indicating functional classes. For these, rasters and firing rates for neurons are provided in clockwise order, for class I−A+, A+, I+A+ (for both the Narrow (blue) and Wide condition (green)), I+, I+A−, I−A− and I−. Gray lines indicate test trials whereas blue/green lines indicate firing rates on paired trials for each condition. Activity is aligned to the onset of the Light cue (0 ms, dashed line) and the mean of both conditions is marked at 350 ms. Times of airpuff(s) for each condition are also indicated as dashed lines.

