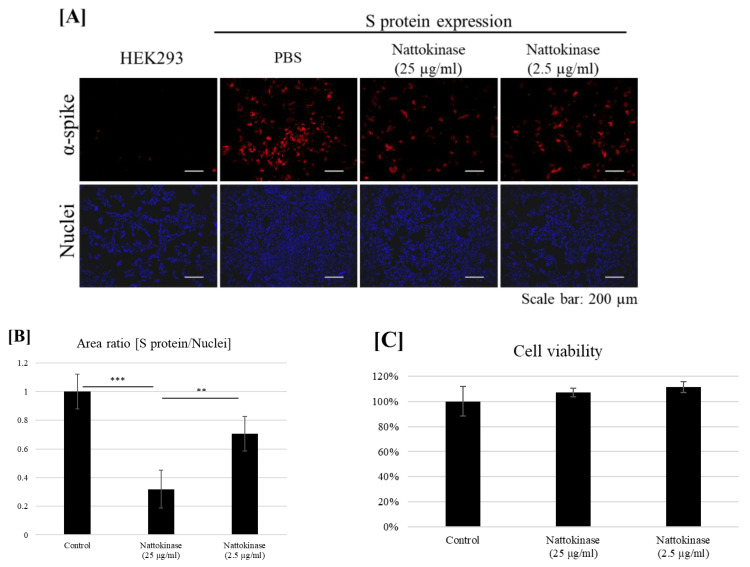
Figure 4. Degradative Effect of Nattokinase on Spike Protein.
(A) Degradative effect of nattokinase on spike protein on the cell surface. Spike-pcDNA3.1 was transfected with HEK293 cells and incubated for 9 h. After incubation, nattokinase (25 and 2.5 µg/mL) was added to the culture medium and further incubated for 13 h. Cells were fixed, and immunofluorescent analysis was performed. S protein on the cell surface was stained with an anti-spike protein antibody (red), and the nucleus was stained with DAPI (blue). (B) Ratio of the S protein area to the nucleus positive area. Three images per sample were captured, and S protein/nucleus positive areas were calculated. Data are shown as mean + SD, and the p-value was determined by one-way analysis of variance (ANOVA) with Tukey’s post-hoc test using R software (R-3.3.3 for Windows) (** p < 0.01; *** p < 0.001). (C) Cell viability was evaluated by an MTT assay. Indicated nattokinase was added to the culture medium and incubated for 13 h; an MTT assay was performed.
*Figure and legend reprinted from Tanikawa et al. [47]. The legend title has been slightly adapted. Permission to use this figure has been granted in accordance with the open access Creative Common CC BY 4.0 license.

