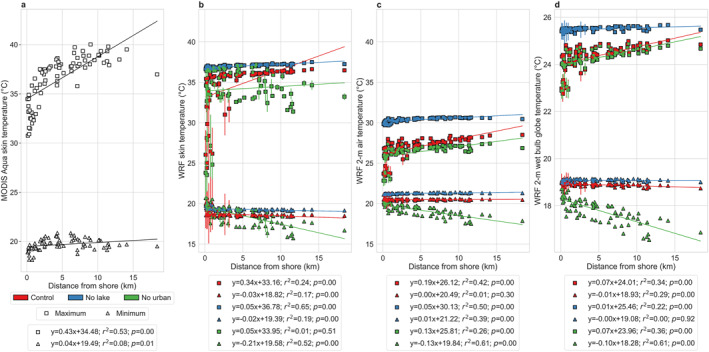
Figure 4.

Lake‐to‐land gradients in measures of heat exposure. Associations between (a) MODIS Aqua daytime and nighttime skin temperature (more accurately, land surface temperature) and WRF simulated maximum and minimum average (b) skin temperature, (c) air temperature, and (d) wet bulb globe temperature in summer 2018 for 77 neighborhoods in Chicago and the corresponding distance of the centroid of each neighborhood to the lake shore. The points represent the mean values from the five members of the ensemble and the error bars correspond to standard errors across the members. The lines of best fit are shown and the associated equations, coefficients of determination, and p values are in the legend. The square symbols show the maximum averages (daytime for MODIS) and the triangles are for the minimum averages (nighttime for MODIS). The three colors (red, blue, and green) show the results for control, no lake, and no urban simulations, respectively.
