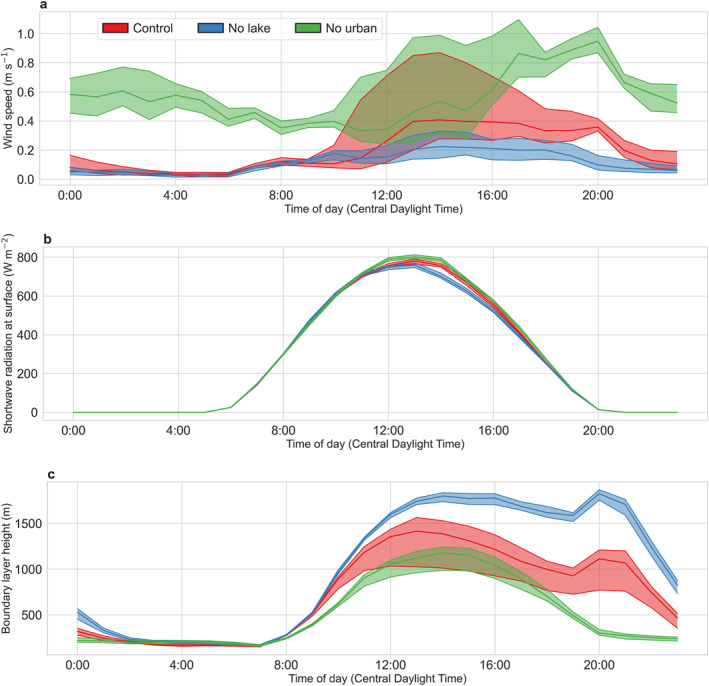
Figure 5.

Diurnal variability of other relevant factors. Diurnal composites of (a) wind speed, (b) incoming shortwave radiation, and c boundary layer height in summer 2018 across model grids overlaying Chicago. The upper and lower lines represent the 75% and 25% percentile (across grids) of the mean values, and the middle line is for the median, all by hour of the day. Results are shown for the first member of the ensemble of WRF simulations.
