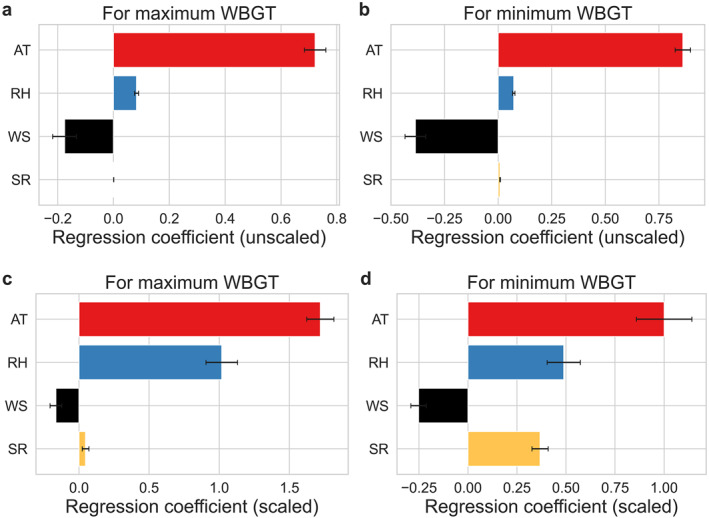
Figure 6.

Sensitivity of wet bulb globe temperature to factors. Regression coefficients for air temperature (AT), relative humidity (RH), wind speed (WS), and incoming shortwave radiation (SR) from multiple linear regressions that explain spatial variability of (a) maximum and (b) minimum wet bulb globe temperature (WBGT) over the model grid overlaying Chicago. The error bars show the standard error across the five members of the ensemble. (c and d) are similar to a and b, but from regressions where all variables have been scaled to lie between 0 and 1.
