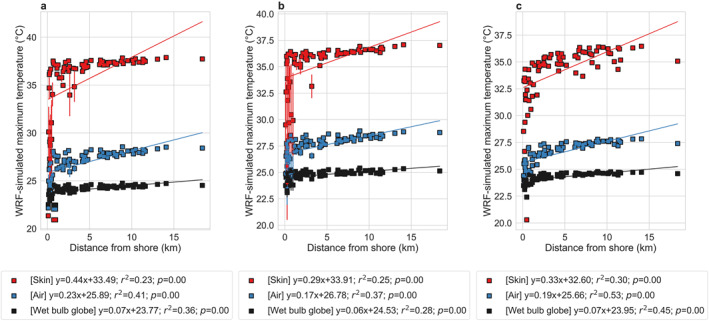
Figure 8.

Comparing lake‐to‐land gradients in maximum average of the variables across model configurations. Associations between maximum average skin temperature, air temperature, and wet bulb globe temperature in summer 2018 for Chicago neighborhoods and the corresponding distance of the centroid of each community area to the lake shore from WRF simulations with (a) NOAH land surface model, (b) MYJ boundary layer scheme, and (c) three‐way nesting. The points represent the mean values (five‐member ensemble for (a) and three‐member ensemble for (b) and the error bars correspond to standard errors across the members when they are used. The lines of best fit are shown and the associated equations, coefficients of determination, and p values are in the legend.
