Fig. 3.
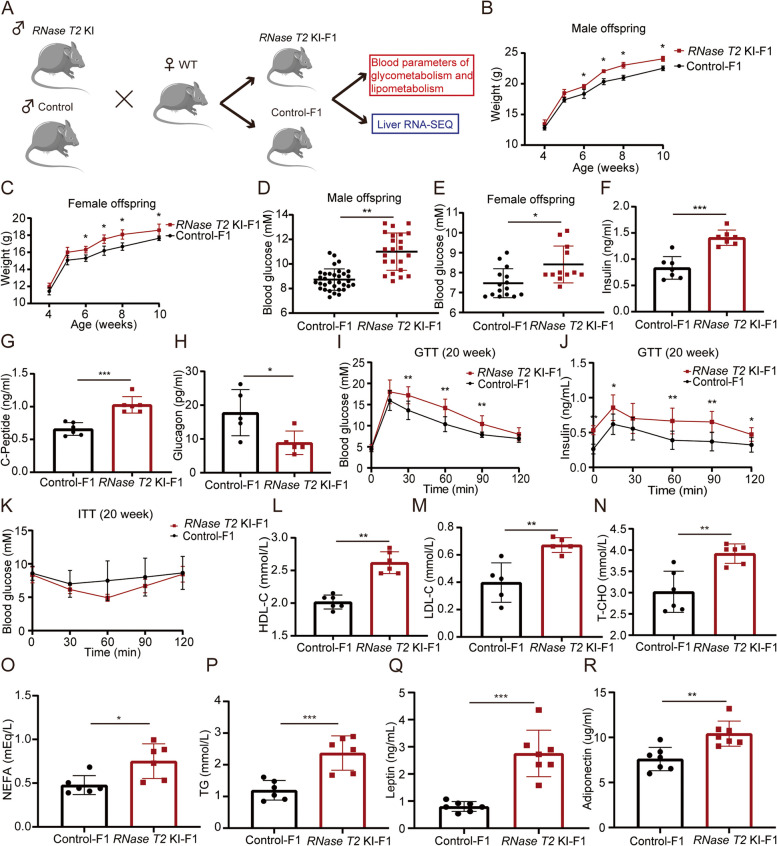
F1 of RNase T2 KI develop glucose and lipid metabolism disorders. A Schematic of the mating strategy and technical analyses. WT female mice were mated with either control males or RNase T2 KI males, respectively, to generate corresponding offspring (F1) for further analyses. B, C RNase T2 KI offspring, both males (B) and females (C). In 6-week-old mice, they had significantly higher body weight than control offspring (n = 8). D, E RNase T2 KI offspring, both males (D) and females (E). In 20-week-old mice, they had higher blood glucose levels than those in the control offspring (n = 12 to 33). F–H The levels of insulin, C-peptide, and glucagon were compared between RNase T2 KI-F1 and control-F1 mice (n = 5 to 7). I, J Result of glucose tolerance test (GTT) showed that there were higher levels of blood glucose and insulin in RNase T2 KI-F1 mice, indicating RNase T2 KI-F1 develop glucose tolerance impairment (n = 7). K Blood glucose dynamics during the insulin tolerance tests (ITT) showed no differences between two groups (n = 5). L–R The levels of HDL-C (L), LDL-C (M), T-CHO (N), NEFA (O), TG (P), leptin (Q), and adiponectin (R) were significantly higher in the serum of RNase T2 KI-F1 (n = 5 to 7). Data are expressed as means ± SD; *P < 0.05, **P < 0.01 and ***P < 0.001

