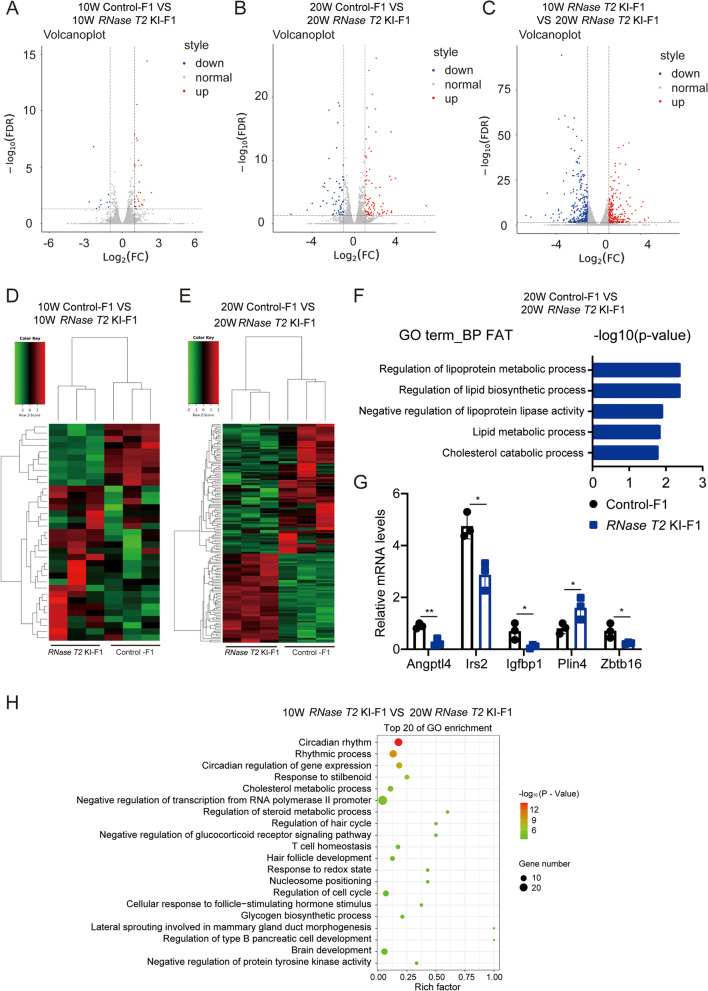
Fig. 4.
RNase T2 KI induced the mRNA expression changes in the liver of F1 offspring. A–C Volcano plot of differential expressed genes between following groups, RNase T2 KI-F1 vs. control-F1 at 10-week-old (A), RNase T2 KI-F1 vs. control-F1 at 20-week-old (B), and RNase T2 KI-F1 at 10-week-old vs. that at 20-week-old (C) (n = 3). D, E Heatmap of the differential expression of genes in livers from RNase T2 KI-F1 and control-F1 in 10-week and 20-week-old mice. Data were from 3 independent samples in each group respectively. F GO enrichment analysis of DEGs in the liver between RNase T2 KI-F1 and control-F1 in 20-week-old mice reveal the enrichment of lipid metabolism pathway. G RT-qPCR analysis confirmed the differential expression of some metabolism-related genes in the liver of F1 mice that coincide with their levels which were shown by RNA sequencing (n = 3). H GO enrichment analysis of DEGs between RNase T2 KI-F1 at 10-week-old and 20-week-old. Data are expressed as means ± SD; *P < 0.05 and **P < 0.01

